Target 2010 Annual Report Download - page 63
Download and view the complete annual report
Please find page 63 of the 2010 Target annual report below. You can navigate through the pages in the report by either clicking on the pages listed below, or by using the keyword search tool below to find specific information within the annual report.-
 1
1 -
2
-
3
-
4
-
5
-
6
-
7
-
8
-
9
-
10
-
11
-
12
-
13
-
14
-
15
-
16
-
17
-
18
-
19
-
20
-
21
-
22
-
23
-
24
-
25
-
26
-
27
-
28
-
29
-
30
-
31
-
32
-
33
-
34
-
35
-
36
-
37
-
38
-
39
-
40
-
41
-
42
-
43
-
44
-
45
-
46
-
47
-
48
-
49
-
50
-
51
-
52
-
 53
53 -
 54
54 -
 55
55 -
 56
56 -
 57
57 -
 58
58 -
 59
59 -
 60
60 -
 61
61 -
 62
62 -
 63
63 -
 64
64 -
 65
65 -
 66
66 -
 67
67 -
 68
68 -
 69
69 -
 70
70 -
 71
71 -
 72
72 -
 73
73 -
74
-
75
-
76
-
77
-
78
-
79
-
80
-
81
-
82
-
83
-
84
-
85
-
86
-
87
-
88
-
89
-
90
-
91
-
92
-
93
-
94
-
95
-
96
-
97
-
98
-
99
-
100
-
101
-
102
-
103
 |
 |

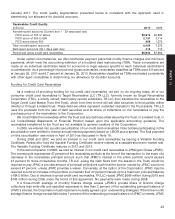
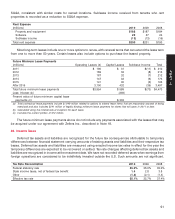
assumptions regarding how market participants price the intangible assets at the measurement date. We classify
these measurements as Level 3.
Fair Value Measurements – Nonrecurring Basis
Other current assets Property and equipment Other noncurrent assets
(millions) Long-lived assets held for sale Long-lived assets held and used (a) Intangible asset
Measured during the year
ended January 29, 2011:
Carrying amount $9 $127 $—
Fair value measurement 7 101 —
Gain/(loss) $ (2) $ (26) $—
Measured during the year
ended January 30, 2010:
Carrying amount $ 74 $ 98 $6
Fair value measurement 57 66 —
Gain/(loss) $(17) $ (32) $ (6)
(a) Primarily relates to real estate and buildings intended for sale in the future but not currently meeting the held for sale criteria.
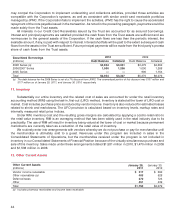
The following table presents the carrying amounts and estimated fair values of financial instruments not
measured at fair value in the Consolidated Statements of Financial Position. The fair value of marketable securities
is determined using available market prices at the reporting date. The fair value of debt is generally measured using
a discounted cash flow analysis based on our current market interest rates for similar types of financial instruments.
January 29, 2011 January 30, 2010
Financial Instruments Not Measured at Fair Value
Carrying Fair Carrying Fair
(millions) Amount Value Amount Value
Financial assets
Other current assets
Marketable securities (a) $ 32 $ 32 $ 27 $ 27
Other noncurrent assets
Marketable securities (a) 44 55
Total $ 36 $ 36 $ 32 $ 32
Financial liabilities
Total debt (b) $15,241 $16,661 $16,447 $17,487
Total $15,241 $16,661 $16,447 $17,487
(a) Amounts include held-to-maturity government and money market investments that are held to satisfy the regulatory requirements of Target
Bank and Target National Bank.
(b) Represents the sum of nonrecourse debt collateralized by credit card receivables, unsecured debt and other borrowings, excluding
unamortized swap valuation adjustments and capital lease obligations.
The carrying amounts of credit card receivables, net of allowance, accounts payable, and certain accrued and
other current liabilities approximate fair value at January 29, 2011.
9. Cash Equivalents
Cash equivalents include highly liquid investments with an original maturity of three months or less from the
time of purchase. Cash equivalents also include amounts due from third-party financial institutions for credit and
debit card transactions. These receivables typically settle in less than five days and were $313 million at January 29,
2011 and January 30, 2010. Payables due to Visa resulting from the use of Target Visa Cards are included within
cash equivalents and were $36 million and $40 million at January 29, 2011 and January 30, 2010, respectively.
41
PART II