Target 2010 Annual Report Download - page 87
Download and view the complete annual report
Please find page 87 of the 2010 Target annual report below. You can navigate through the pages in the report by either clicking on the pages listed below, or by using the keyword search tool below to find specific information within the annual report.-
 1
1 -
2
-
3
-
4
-
5
-
6
-
7
-
8
-
9
-
10
-
11
-
12
-
13
-
14
-
15
-
16
-
17
-
18
-
19
-
20
-
21
-
22
-
23
-
24
-
25
-
26
-
27
-
28
-
29
-
30
-
31
-
32
-
33
-
34
-
35
-
36
-
37
-
38
-
39
-
40
-
41
-
42
-
43
-
44
-
45
-
46
-
47
-
48
-
49
-
50
-
51
-
52
-
53
-
54
-
55
-
56
-
57
-
58
-
59
-
60
-
61
-
62
-
63
-
64
-
65
-
66
-
67
-
68
-
69
-
70
-
71
-
72
-
73
-
74
-
75
-
76
-
 77
77 -
 78
78 -
 79
79 -
 80
80 -
 81
81 -
 82
82 -
 83
83 -
 84
84 -
 85
85 -
 86
86 -
 87
87 -
 88
88 -
 89
89 -
 90
90 -
 91
91 -
 92
92 -
 93
93 -
 94
94 -
 95
95 -
 96
96 -
 97
97 -
98
-
99
-
100
-
101
-
102
-
103
 |
 |

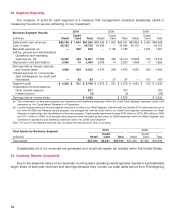
through the end of December. We follow the same accounting policies for preparing quarterly and annual financial
data. The table below summarizes quarterly results for 2010 and 2009:
Quarterly Results First Quarter Second Quarter Third Quarter Fourth Quarter Total Year
(millions, except per
share data) 2010 2009 2010 2009 2010 2009 2010 2009 2010 2009
Total revenues $15,593 $14,833 $15,532 $15,067 $15,605 $15,276 $20,661 $20,181 $67,390 $65,357
Earnings before income
taxes 1,055 824 1,081 957 773 683 1,588 1,409 4,495 3,872
Net earnings 671 522 679 594 535 436 1,035 936 2,920 2,488
Basic earnings per share 0.91 0.69 0.93 0.79 0.75 0.58 1.46 1.25 4.03 3.31
Diluted earnings per
share 0.90 0.69 0.92 0.79 0.74 0.58 1.45 1.24 4.00 3.30
Dividends declared per
share 0.17 0.16 0.25 0.17 0.25 0.17 0.25 0.17 0.92 0.67
Closing common stock
price
High 58.05 41.26 57.13 43.79 55.05 51.35 60.77 52.02 60.77 52.02
Low 48.64 25.37 49.00 36.75 50.72 41.38 53.48 45.30 48.64 25.37
Note: Per share amounts are computed independently for each of the quarters presented. The sum of the quarters may not equal the total year
amount due to the impact of changes in average quarterly shares outstanding and all other quarterly amounts may not equal the total year due to
rounding.
65
PART II