Target 2010 Annual Report Download - page 41
Download and view the complete annual report
Please find page 41 of the 2010 Target annual report below. You can navigate through the pages in the report by either clicking on the pages listed below, or by using the keyword search tool below to find specific information within the annual report.-
 1
1 -
2
-
3
-
4
-
5
-
6
-
7
-
8
-
9
-
10
-
11
-
12
-
13
-
14
-
15
-
16
-
17
-
18
-
19
-
20
-
21
-
22
-
23
-
24
-
25
-
26
-
27
-
28
-
29
-
30
-
 31
31 -
 32
32 -
 33
33 -
 34
34 -
 35
35 -
 36
36 -
 37
37 -
 38
38 -
 39
39 -
 40
40 -
 41
41 -
 42
42 -
 43
43 -
 44
44 -
 45
45 -
 46
46 -
 47
47 -
 48
48 -
 49
49 -
 50
50 -
 51
51 -
52
-
53
-
54
-
55
-
56
-
57
-
58
-
59
-
60
-
61
-
62
-
63
-
64
-
65
-
66
-
67
-
68
-
69
-
70
-
71
-
72
-
73
-
74
-
75
-
76
-
77
-
78
-
79
-
80
-
81
-
82
-
83
-
84
-
85
-
86
-
87
-
88
-
89
-
90
-
91
-
92
-
93
-
94
-
95
-
96
-
97
-
98
-
99
-
100
-
101
-
102
-
103
 |
 |

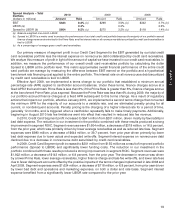
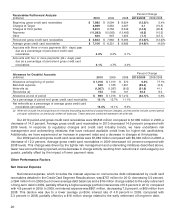
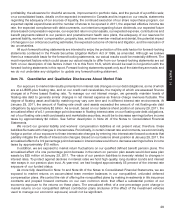
Spread Analysis – Total 2010 2009 2008
Portfolio
(dollars in millions) Amount Rate Amount Rate Amount Rate
EBIT $624 8.8% (c) $298 3.5% (c) $322 3.7% (c)
LIBOR (a) 0.3% 0.3% 2.3%
Spread to LIBOR (b) $604 8.5% (c) $270 3.2% (c) $118 1.4% (c)
(a) Balance-weighted one-month LIBOR.
(b) Spread to LIBOR is a metric used to analyze the performance of our total credit card portfolio because the majority of our portfolio earned
finance charge revenue at rates tied to the Prime Rate, and the interest rate on all nonrecourse debt securitized by credit card receivables is
tied to LIBOR.
(c) As a percentage of average gross credit card receivables.
Our primary measure of segment profit in our Credit Card Segment is the EBIT generated by our total credit
card receivables portfolio less the interest expense on nonrecourse debt collateralized by credit card receivables.
We analyze this measure of profit in light of the amount of capital we have invested in our credit card receivables. In
addition, we measure the performance of our overall credit card receivables portfolio by calculating the dollar
Spread to LIBOR at the portfolio level. This metric approximates overall financial performance of the entire credit
card portfolio we manage by measuring the difference between EBIT earned on the portfolio and a hypothetical
benchmark rate financing cost applied to the entire portfolio. The interest rate on all nonrecourse debt securitized
by credit card receivables is tied to LIBOR.
Effective April 2009, we implemented a terms change to our portfolio that established a minimum annual
percentage rate (APR) applied to cardholder account balances. Under these terms, finance charges accrue at a
fixed APR if the benchmark Prime Rate is less than 6%; if the Prime Rate is greater than 6%, finance charges accrue
at the benchmark Prime Rate, plus a spread. Because the Prime Rate was less than 6% during 2009, the majority of
our portfolio accrued finance charges at a fixed APR subsequent to this terms change. As a result of regulatory
actions that impact our portfolio, effective January 2010, we implemented a second terms change that converted
the minimum APR for the majority of our accounts to a variable rate, and we eliminated penalty pricing for all
current, or nondelinquent accounts. Penalty pricing is the charging of a higher interest rate for a period of time,
generally 12 months, and is triggered when a cardholder repeatedly fails to make timely payments. Additionally,
beginning in August 2010 late fee limitations went into effect that resulted in reduced late fee revenue.
In 2010, Credit Card Segment profit increased to $541 million from $201 million, driven mostly by favorability in
bad debt expense. The reduction in our investment in the portfolio combined with these results produced a strong
improvement in segment ROIC. Segment revenues were $1,604 million, a decrease of $318 million, or 16.5 percent,
from the prior year, which was primarily driven by lower average receivables as well as reduced late fees. Segment
expenses were $980 million, a decrease of $644 million, or 39.7 percent, from prior year driven primarily by lower
bad debt expense due to lower actual and expected write-offs. Segment interest expense on nonrecourse debt
declined due to a decrease in nonrecourse debt securitized by credit card receivables.
In 2009, Credit Card Segment profit increased to $201 million from $155 million as a result of improved portfolio
performance (Spread to LIBOR) and significantly lower funding costs. The reduction in our investment in the
portfolio combined with these results produced a strong improvement in segment ROIC. Segment revenues were
$1,922 million, a decrease of $143 million, or 6.9 percent, from the prior year. The decrease in revenue was driven
by a lower Prime Rate, lower average receivables, higher finance charge and late-fee write-offs, and lower late fees
due to fewer delinquent accounts offset by the positive impacts of the terms changes implemented in late 2008 and
April 2009. Segment expenses were $1,624 million, a decrease of $118 million, or 6.8 percent, from prior year driven
by lower bad debt and operations and marketing expenses, on both a dollar and rate basis. Segment interest
expense benefited from a significantly lower LIBOR rate compared to the prior year.
19
PART II