Target 2010 Annual Report Download - page 43
Download and view the complete annual report
Please find page 43 of the 2010 Target annual report below. You can navigate through the pages in the report by either clicking on the pages listed below, or by using the keyword search tool below to find specific information within the annual report.-
 1
1 -
2
-
3
-
4
-
5
-
6
-
7
-
8
-
9
-
10
-
11
-
12
-
13
-
14
-
15
-
16
-
17
-
18
-
19
-
20
-
21
-
22
-
23
-
24
-
25
-
26
-
27
-
28
-
29
-
30
-
31
-
32
-
 33
33 -
 34
34 -
 35
35 -
 36
36 -
 37
37 -
 38
38 -
 39
39 -
 40
40 -
 41
41 -
 42
42 -
 43
43 -
 44
44 -
 45
45 -
 46
46 -
 47
47 -
 48
48 -
 49
49 -
 50
50 -
 51
51 -
 52
52 -
 53
53 -
54
-
55
-
56
-
57
-
58
-
59
-
60
-
61
-
62
-
63
-
64
-
65
-
66
-
67
-
68
-
69
-
70
-
71
-
72
-
73
-
74
-
75
-
76
-
77
-
78
-
79
-
80
-
81
-
82
-
83
-
84
-
85
-
86
-
87
-
88
-
89
-
90
-
91
-
92
-
93
-
94
-
95
-
96
-
97
-
98
-
99
-
100
-
101
-
102
-
103
 |
 |

Provision for Income Taxes
Our effective income tax rate was 35.1 percent in 2010 and 35.7 percent in 2009. The decrease in the effective
rate between periods is primarily due to the favorable resolution of various income tax matters, which reduced
income tax expense by approximately $100 million.
Our effective income tax rate was 35.7 percent in 2009 and 37.4 percent in 2008. The decrease in the effective
rate between periods is primarily due to nontaxable capital market returns on investments used to economically
hedge the market risk in deferred compensation plans in 2009, compared with nondeductible losses in 2008. The
2009 effective income tax rate is also lower due to federal and state discrete items.
Analysis of Financial Condition
Liquidity and Capital Resources
Our period end cash and cash equivalents balance was $1,712 million compared with $2,200 million in 2009.
Marketable securities of $1,129 million and $1,617 million were included in cash and cash equivalents at the end of
2010 and 2009, respectively. Our investment policy is designed to preserve principal and liquidity of our marketable
securities. This policy allows investments in large money market funds or in highly rated direct short-term
instruments that mature in 60 days or less. We also place certain limitations on the aggregate dollars invested and
percentage of total fund value held when making short-term investment decisions.
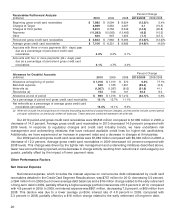
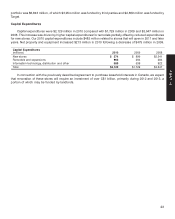
Our 2010 operations were funded by both internally and externally generated funds. Cash flow provided by
operations was $5,271 million in 2010 compared with $5,881 million in 2009. This cash flow, combined with our
prior year-end cash position and the debt issuance described below, allowed us to fund capital expenditures of
$2,129 million and pay off $2,259 million of debt. In addition, in 2010 we increased our share repurchases and
raised dividends paid to our shareholders.
Our 2010 period-end gross credit card receivables were $6,843 million compared with $7,982 million in 2009, a
decrease of 14.3 percent. Average gross credit card receivables in 2010 decreased 14.9 percent compared with
2009 levels. This change was driven by the factors indicated in the Credit Card Segment above. This trend and the
factors influencing it are likely to continue into 2011. Due to the decrease in gross credit card receivables, Target
Receivables LLC (TR LLC), formerly known as Target Receivables Corporation (TRC), using cash flows from the
receivables, repaid an affiliate of JPMorgan Chase (JPMC) $566 million and $163 million during 2010 and 2009,
respectively, under the terms of our agreement with them as described in Note 10 of the Notes to Consolidated
Financial Statements. To the extent the receivables balance continues to decline, TR LLC expects to continue to pay
JPMC a prorata portion of principal collections such that the portion owned by JPMC would not exceed 47 percent.
Year-end inventory levels increased $417 million, or 5.8 percent from 2009. Inventory levels were higher to
support traffic-driving strategic initiatives, such as our expanded food assortment in general merchandise stores
and pharmacy, in addition to comparatively higher retail square footage. Accounts payable increased by
$115 million, or 1.8 percent over the same period.
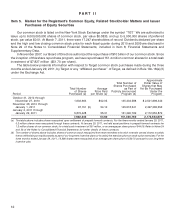
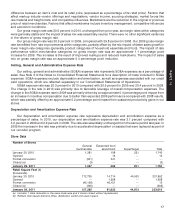
During 2010, we repurchased 47.8 million shares of our common stock for a total cash investment of
$2,508 million ($52.44 per share) under a $10 billion share repurchase plan authorized by our Board of Directors in
November 2007. In 2009, we repurchased 9.9 million shares of our common stock for a total cash investment of
$479 million ($48.54 per share).
We paid dividends totaling $609 million in 2010 and $496 million in 2009, an increase of 22.7 percent. We
declared dividends totaling $659 million ($0.92 per share) in 2010, an increase of 31.1 percent over 2009. In 2009,
we declared dividends totaling $503 million ($0.67 per share), an increase of 6.8 percent over 2008. We have paid
dividends every quarter since our first dividend was declared following our 1967 initial public offering, and it is our
intent to continue to do so in the future.
Our financing strategy is to ensure liquidity and access to capital markets, to manage our net exposure to
floating interest rate volatility, and to maintain a balanced spectrum of debt maturities. Within these parameters, we
seek to minimize our borrowing costs. As described in Note 19, in July 2010, we issued $1 billion of long-term debt
at 3.875% that matures in July 2020. There were no amounts issued in 2009.
21
PART II