Target 2010 Annual Report Download - page 86
Download and view the complete annual report
Please find page 86 of the 2010 Target annual report below. You can navigate through the pages in the report by either clicking on the pages listed below, or by using the keyword search tool below to find specific information within the annual report.-
 1
1 -
2
-
3
-
4
-
5
-
6
-
7
-
8
-
9
-
10
-
11
-
12
-
13
-
14
-
15
-
16
-
17
-
18
-
19
-
20
-
21
-
22
-
23
-
24
-
25
-
26
-
27
-
28
-
29
-
30
-
31
-
32
-
33
-
34
-
35
-
36
-
37
-
38
-
39
-
40
-
41
-
42
-
43
-
44
-
45
-
46
-
47
-
48
-
49
-
50
-
51
-
52
-
53
-
54
-
55
-
56
-
57
-
58
-
59
-
60
-
61
-
62
-
63
-
64
-
65
-
66
-
67
-
68
-
69
-
70
-
71
-
72
-
73
-
74
-
75
-
 76
76 -
 77
77 -
 78
78 -
 79
79 -
 80
80 -
 81
81 -
 82
82 -
 83
83 -
 84
84 -
 85
85 -
 86
86 -
 87
87 -
 88
88 -
 89
89 -
 90
90 -
 91
91 -
 92
92 -
 93
93 -
 94
94 -
 95
95 -
 96
96 -
97
-
98
-
99
-
100
-
101
-
102
-
103
 |
 |

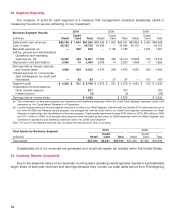
28. Segment Reporting
Our measure of profit for each segment is a measure that management considers analytically useful in
measuring the return we are achieving on our investment.
2010 2009 2008
Business Segment Results
Credit Credit Credit
(millions) Retail Card Total Retail Card Total Retail Card Total
Sales/Credit card revenues $65,786 $ 1,604 $67,390 $63,435 $ 1,922 $65,357 $62,884 $ 2,064 $64,948
Cost of sales 45,725 — 45,725 44,062 — 44,062 44,157 — 44,157
Bad debt expense (a) — 528 528 — 1,185 1,185 — 1,251 1,251
Selling, general and administrative/
Operations and marketing
expenses (a), (b) 13,367 433 13,801 12,989 425 13,414 12,838 474 13,312
Depreciation and amortization 2,065 19 2,084 2,008 14 2,023 1,808 17 1,826
Earnings before interest expense
and income taxes 4,629 624 5,252 4,376 298 4,673 4,081 322 4,402
Interest expense on nonrecourse
debt collateralized by credit card
receivables — 83 83 — 97 97 — 167 167
Segment profit $ 4,629 $ 541 $ 5,169 $ 4,376 $ 201 $ 4,576 $ 4,081 $ 155 $ 4,236
Unallocated (income)/expense:
Other interest expense 677 707 727
Interest income (3) (3) (28)
Earnings before income taxes $ 4,495 $ 3,872 $ 3,536
(a) The combination of bad debt expense and operations and marketing expenses within the Credit Card Segment represent credit card
expenses on the Consolidated Statements of Operations.
(b) Loyalty Program discounts are recorded as reductions to sales in our Retail Segment. Effective with the October 2010 nationwide launch of
our new 5% REDcard Rewards loyalty program, we changed the formula under which our Credit Card segment reimburses our Retail
Segment to better align with the attributes of the new program. These reimbursed amounts were $102 million in 2010, $89 million in 2009
and $117 million in 2008. In all periods these amounts were recorded as reductions to SG&A expenses within the Retail Segment and
increases to operations and marketing expenses within the Credit Card Segment.
Note: The sum of the segment amounts may not equal the total amounts due to rounding.
2010 2009
Total Assets by Business Segment
Credit Credit
(millions) Retail Card Total Retail Card Total
Total assets $37,324 $6,381 $43,705 $37,200 $7,333 $44,533
Substantially all of our revenues are generated and long-lived assets are located within the United States.
29. Quarterly Results (Unaudited)
Due to the seasonal nature of our business, fourth quarter operating results typically represent a substantially
larger share of total year revenues and earnings because they include our peak sales period from Thanksgiving
64