Target 2010 Annual Report Download - page 48
Download and view the complete annual report
Please find page 48 of the 2010 Target annual report below. You can navigate through the pages in the report by either clicking on the pages listed below, or by using the keyword search tool below to find specific information within the annual report.-
 1
1 -
2
-
3
-
4
-
5
-
6
-
7
-
8
-
9
-
10
-
11
-
12
-
13
-
14
-
15
-
16
-
17
-
18
-
19
-
20
-
21
-
22
-
23
-
24
-
25
-
26
-
27
-
28
-
29
-
30
-
31
-
32
-
33
-
34
-
35
-
36
-
37
-
 38
38 -
 39
39 -
 40
40 -
 41
41 -
 42
42 -
 43
43 -
 44
44 -
 45
45 -
 46
46 -
 47
47 -
 48
48 -
 49
49 -
 50
50 -
 51
51 -
 52
52 -
 53
53 -
 54
54 -
 55
55 -
 56
56 -
 57
57 -
 58
58 -
59
-
60
-
61
-
62
-
63
-
64
-
65
-
66
-
67
-
68
-
69
-
70
-
71
-
72
-
73
-
74
-
75
-
76
-
77
-
78
-
79
-
80
-
81
-
82
-
83
-
84
-
85
-
86
-
87
-
88
-
89
-
90
-
91
-
92
-
93
-
94
-
95
-
96
-
97
-
98
-
99
-
100
-
101
-
102
-
103
 |
 |
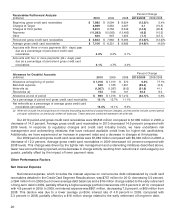
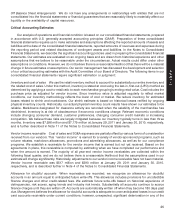
factors mentioned above or in general economic conditions could materially change these expectations. During
2010, we continued risk management and underwriting initiatives that reduced available credit lines for higher-risk
cardholders. In addition, we experienced an increase in payment rates and a decrease in charge activity from
reductions in card usage by our guests. As a result of these trends, our allowance for doubtful accounts related to
our credit card receivables decreased $326 million, from $1,016 million, or 12.7 percent of gross credit card
receivables, at January 30, 2010 to $690 million, or 10.1 percent of gross credit card receivables, at January 29,
2011. Credit card receivables and our allowance for doubtful accounts are described in Note 10 of the Notes to
Consolidated Financial Statements.
Long-lived assets Long-lived assets are reviewed for impairment whenever events or changes in circumstances
indicate that the carrying amount of an asset (or asset group) may not be recoverable. An impairment loss would be
recognized when estimated undiscounted future cash flows from the operation and disposition of the asset group
are less than the carrying amount of the asset group. Asset groups have identifiable cash flows independent of
other asset groups. Measurement of an impairment loss would be based on the excess of the carrying amount of
the asset group over its fair value. Fair value is measured using discounted cash flows or independent opinions of
value, as appropriate. A 10 percent decrease in the fair value of assets we intend to sell as of January 29, 2011
would result in additional impairment of approximately $12 million in 2010. Historically, we have not realized
material losses upon sale of long-lived assets.
Goodwill and intangible assets We evaluate goodwill and intangible assets for impairment annually, or whenever
events or changes in circumstances indicate the carrying value of the asset may not be recoverable. Discounted
cash flow models are used in determining fair value of goodwill and intangible assets. Growth rates for sales and
profits are determined using inputs from our long-range planning process. We also make estimates of discount
rates, perpetuity growth rates, and other factors. As of January 29, 2011 and January 30, 2010, we had $223 million
and $239 million of goodwill and intangible assets, respectively. While we currently believe that the fair value of our
goodwill and intangible assets exceeds its carrying value, materially different assumptions regarding future
performance of our businesses or other factors could result in impairment losses.
Insurance/self-insurance We retain a substantial portion of the risk related to certain general liability, workers’
compensation, property loss and team member medical and dental claims. However, we maintain stop-loss
coverage to limit the exposure related to certain risks. Liabilities associated with these losses include estimates of
both claims filed and losses incurred but not yet reported. We use actuarial methods which consider a number of
factors to estimate our ultimate cost of losses. General liability and workers’ compensation liabilities are recorded at
our estimate of their net present value; other liabilities referred to above are not discounted. Our workers’
compensation and general liability accrual was $628 million and $653 million at January 29, 2011 and January 30,
2010, respectively. We believe that the amounts accrued are adequate; however, our liabilities could be significantly
affected if future occurrences or loss developments differ from our assumptions. For example, a 5 percent increase
or decrease in average claim costs would impact our self-insurance expense by approximately $30 million in 2010.
Historically, adjustments to our estimates have not been material. Refer to Item 7A for further disclosure of the
market risks associated with these exposures.
Income taxes We pay income taxes based on the tax statutes, regulations and case law of the various jurisdictions
in which we operate. Significant judgment is required in determining the timing and amounts of deductible and
taxable items and in evaluating the ultimate resolution of tax matters in dispute with tax authorities. The benefits of
uncertain tax positions are recorded in our financial statements only after determining whether it is likely the
uncertain tax positions would withstand challenge by taxing authorities. We periodically reassess these
probabilities, and record any changes in the financial statements as deemed appropriate. Liabilities for tax positions
considered uncertain, including interest and penalties, were $397 million and $579 million at January 29, 2011 and
January 30, 2010, respectively. We believe the resolution of these matters will not have a material adverse impact on
our consolidated financial statements. Income taxes are described further in Note 22 of the Notes to Consolidated
Financial Statements.
26