Target 2010 Annual Report Download - page 42
Download and view the complete annual report
Please find page 42 of the 2010 Target annual report below. You can navigate through the pages in the report by either clicking on the pages listed below, or by using the keyword search tool below to find specific information within the annual report.-
 1
1 -
2
-
3
-
4
-
5
-
6
-
7
-
8
-
9
-
10
-
11
-
12
-
13
-
14
-
15
-
16
-
17
-
18
-
19
-
20
-
21
-
22
-
23
-
24
-
25
-
26
-
27
-
28
-
29
-
30
-
31
-
 32
32 -
 33
33 -
 34
34 -
 35
35 -
 36
36 -
 37
37 -
 38
38 -
 39
39 -
 40
40 -
 41
41 -
 42
42 -
 43
43 -
 44
44 -
 45
45 -
 46
46 -
 47
47 -
 48
48 -
 49
49 -
 50
50 -
 51
51 -
 52
52 -
53
-
54
-
55
-
56
-
57
-
58
-
59
-
60
-
61
-
62
-
63
-
64
-
65
-
66
-
67
-
68
-
69
-
70
-
71
-
72
-
73
-
74
-
75
-
76
-
77
-
78
-
79
-
80
-
81
-
82
-
83
-
84
-
85
-
86
-
87
-
88
-
89
-
90
-
91
-
92
-
93
-
94
-
95
-
96
-
97
-
98
-
99
-
100
-
101
-
102
-
103
 |
 |

Percent Change
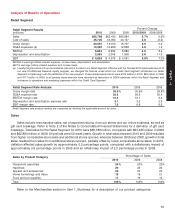
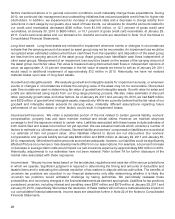
Receivables Rollforward Analysis
(millions) 2010 2009 2008 2010/2009 2009/2008
Beginning gross credit card receivables $ 7,982 $ 9,094 $ 8,624 (12.2)% 5.4%
Charges at Target 3,699 3,553 4,207 4.1 (15.5)
Charges at third parties 5,815 6,763 8,542 (14.0) (20.8)
Payments (11,283) (12,065) (13,482) (6.5) (10.5)
Other 630 637 1,203 (1.1) (47.1)
Period-end gross credit card receivables $ 6,843 $ 7,982 $ 9,094 (14.3)% (12.2)%
Average gross credit card receivables $ 7,106 $ 8,351 $ 8,695 (14.9)% (4.0)%
Accounts with three or more payments (60+ days) past
due as a percentage of period-end credit card
receivables 4.2% 6.3% 6.1%
Accounts with four or more payments (90+ days) past
due as a percentage of period-end gross credit card
receivables 3.1% 4.7% 4.3%
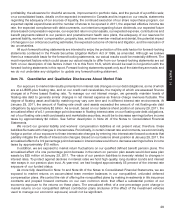
Percent Change
Allowance for Doubtful Accounts
(millions) 2010 2009 2008 2010/2009 2009/2008
Allowance at beginning of period $ 1,016 $ 1,010 $ 570 0.6% 77.1%
Bad debt expense 528 1,185 1,251 (55.4) (5.3)
Write-offs (a) (1,007) (1,287) (912) (21.8) 41.1
Recoveries (a) 153 108 101 40.2 8.3
Allowance at end of period $ 690 $ 1,016 $ 1,010 (32.1)% 0.6%
As a percentage of period-end gross credit card receivables 10.1% 12.7% 11.1%
Net write-offs as a percentage of average gross credit card
receivables (annualized) 12.0% 14.1% 9.3%
(a) Write-offs include the principal amount of losses (excluding accrued and unpaid finance charges), and recoveries include current period
principal collections on previously written-off balances. These amounts combined represent net write-offs.
Our 2010 period-end gross credit card receivables were $6,843 million compared to $7,982 million in 2009, a
decrease of 14.3 percent. Average gross credit card receivables in 2010 decreased 14.9 percent compared with
2009 levels. In response to regulatory changes and credit card industry trends, we have undertaken risk
management and underwriting initiatives that have reduced available credit lines for higher-risk cardholders.
Additionally, we have experienced an increase in payment rates and a decrease in charges at third-parties.
Our 2009 period-end gross credit card receivables were $7,982 million compared with $9,094 million in 2008, a
decrease of 12.2 percent. Average gross credit card receivables in 2009 decreased 4.0 percent compared with
2008 levels. This change was driven by the tighter risk management and underwriting initiatives described above,
fewer new accounts being opened, and a decrease in charge activity resulting from reductions in card usage by our
guests, partially offset by the impact of lower payment rates.
Other Performance Factors
Net Interest Expense
Net interest expense, which includes the interest expense on nonrecourse debt collateralized by credit card
receivables detailed in the Credit Card Segment Results above, was $757 million for 2010, decreasing 5.5 percent,
or $44 million from 2009 due to lower average debt balances and a $16 million charge related to the early retirement
of long-term debt in 2009, partially offset by a higher average portfolio interest rate of 5.3 percent in 2010, compared
with 4.8 percent in 2009. In 2009, net interest expense was $801 million, decreasing 7.5 percent, or $65 million from
2008. This decline was due to a lower average portfolio interest rate of 4.8 percent in 2009, compared with
5.3 percent in 2008, partially offset by a $16 million charge related to the early retirement of long-term debt.
20