Target 2010 Annual Report Download - page 36
Download and view the complete annual report
Please find page 36 of the 2010 Target annual report below. You can navigate through the pages in the report by either clicking on the pages listed below, or by using the keyword search tool below to find specific information within the annual report.-
 1
1 -
2
-
3
-
4
-
5
-
6
-
7
-
8
-
9
-
10
-
11
-
12
-
13
-
14
-
15
-
16
-
17
-
18
-
19
-
20
-
21
-
22
-
23
-
24
-
25
-
 26
26 -
 27
27 -
 28
28 -
 29
29 -
 30
30 -
 31
31 -
 32
32 -
 33
33 -
 34
34 -
 35
35 -
 36
36 -
 37
37 -
 38
38 -
 39
39 -
 40
40 -
 41
41 -
 42
42 -
 43
43 -
 44
44 -
 45
45 -
 46
46 -
47
-
48
-
49
-
50
-
51
-
52
-
53
-
54
-
55
-
56
-
57
-
58
-
59
-
60
-
61
-
62
-
63
-
64
-
65
-
66
-
67
-
68
-
69
-
70
-
71
-
72
-
73
-
74
-
75
-
76
-
77
-
78
-
79
-
80
-
81
-
82
-
83
-
84
-
85
-
86
-
87
-
88
-
89
-
90
-
91
-
92
-
93
-
94
-
95
-
96
-
97
-
98
-
99
-
100
-
101
-
102
-
103
 |
 |

Item 6. Selected Financial Data
As of or for the Year Ended
(millions, except per share data) 2010 2009 2008 2007 2006(a) 2005
Financial Results:
Total revenues $67,390 $65,357 $64,948 $63,367 $59,490 $52,620
Net earnings 2,920 2,488 2,214 2,849 2,787 2,408
Per Share:
Basic earnings per share 4.03 3.31 2.87 3.37 3.23 2.73
Diluted earnings per share 4.00 3.30 2.86 3.33 3.21 2.71
Cash dividends declared per share 0.92 0.67 0.62 0.54 0.46 0.38
Financial Position:
Total assets 43,705 44,533 44,106 44,560 37,349 34,995
Long-term debt, including current portion 15,726 16,814 18,752 16,590 10,037 9,872
(a) Consisted of 53 weeks.
Item 7. Management’s Discussion and Analysis of Financial Condition and Results of
Operations
Executive Summary
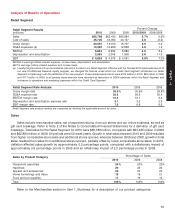
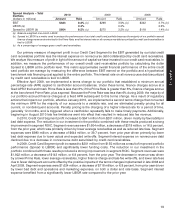
Our 2010 Retail Segment sales increased 3.7 percent over last year due to a 2.1 percent comparable-store
increase combined with the contribution from new stores. Our Retail Segment EBITDA and EBIT increased
4.9 percent and 5.8 percent, respectively, compared with the prior year. In the Credit Card Segment, we achieved a
significant increase in segment profit primarily due to declining bad debt expense driven by improved trends in key
measures of risk.
Cash flow provided by operations was $5,271 million, $5,881 million and $4,430 million for 2010, 2009 and
2008, respectively. We opened 13 new stores and 76 new stores in 2010 and 2009, respectively. In 2010 we
remodeled 341 stores, significantly more than the 67 stores we remodeled in 2009. Additionally, during 2010 and
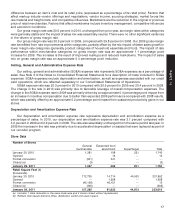
2009 we repurchased 47.8 million and 9.9 million shares of our common stock for a total cash investment of
$2,508 million ($52.44 per share) and $479 million ($48.54 per share), respectively.
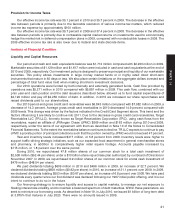
In January 2011, we entered into an agreement to purchase the leasehold interests in up to 220 sites in Canada
currently operated by Zellers Inc., in exchange for C$1,825 million (Canadian dollars), due in two payments, one in
May 2011 and one in September 2011. We believe this transaction will allow us to open 100 to 150 Target stores in
Canada, primarily during 2013. We expect that renovation of these stores will require an investment of over
C$1 billion, a portion of which may be funded by landlords. At January 29, 2011 the value of C$1.00 approximated
the value of $1.00.
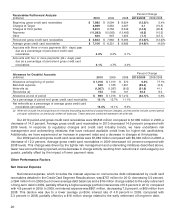
Additionally, in January 2011, we announced our plan to actively pursue the sale of our credit card receivables
portfolio. As of January 29, 2011 the gross balance of our credit card receivables portfolio was $6,843 million, of
which $3,954 million was funded by third parties and $2,889 million was funded by Target. Refer to Note 10 of the
Notes to Consolidated Financial Statements for further description of historical financing transactions related to our
credit card receivables.
Management’s Discussion and Analysis is based on our Consolidated Financial Statements in Item 8, Financial
Statements and Supplementary Data.
14