Target 2010 Annual Report Download - page 84
Download and view the complete annual report
Please find page 84 of the 2010 Target annual report below. You can navigate through the pages in the report by either clicking on the pages listed below, or by using the keyword search tool below to find specific information within the annual report.-
 1
1 -
2
-
3
-
4
-
5
-
6
-
7
-
8
-
9
-
10
-
11
-
12
-
13
-
14
-
15
-
16
-
17
-
18
-
19
-
20
-
21
-
22
-
23
-
24
-
25
-
26
-
27
-
28
-
29
-
30
-
31
-
32
-
33
-
34
-
35
-
36
-
37
-
38
-
39
-
40
-
41
-
42
-
43
-
44
-
45
-
46
-
47
-
48
-
49
-
50
-
51
-
52
-
53
-
54
-
55
-
56
-
57
-
58
-
59
-
60
-
61
-
62
-
63
-
64
-
65
-
66
-
67
-
68
-
69
-
70
-
71
-
72
-
73
-
 74
74 -
 75
75 -
 76
76 -
 77
77 -
 78
78 -
 79
79 -
 80
80 -
 81
81 -
 82
82 -
 83
83 -
 84
84 -
 85
85 -
 86
86 -
 87
87 -
 88
88 -
 89
89 -
 90
90 -
 91
91 -
 92
92 -
 93
93 -
 94
94 -
95
-
96
-
97
-
98
-
99
-
100
-
101
-
102
-
103
 |
 |

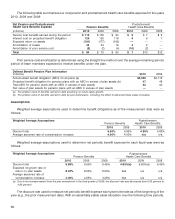
Fair Value
Measurements Fair Value at January 29, 2011 Fair Value at January 30, 2010
(millions) Total Level 1 Level 2 Level 3 Total Level 1 Level 2 Level 3
Cash and cash
equivalents $ 195 $— $ 195 $ — $ 206 $— $ 206 $ —
Common collective
trusts (a) 490 — 490 — 464 — 464 —
Equity securities (b) 36 36 — — 26 26 — —
Government securities (c) 259 — 259 — 223 — 223 —
Fixed income (d) 397 — 397 — 365 — 365 —
Balanced funds (e) 596 — 596 — 404 — 404 —
Private equity funds (f) 327 — — 327 336 — — 336
Other (g) 130 — 3 127 133 — 14 119
Total $2,430 $36 $1,940 $454 $2,157 $26 $1,676 $455
Contributions in transit (h) 85
Total plan assets $2,515
(a) Passively managed index funds with holdings in domestic and international equities.
(b) Investments in U.S. small-, mid- and large-cap companies.
(c) Investments in government securities and passively managed index funds with holdings in long-term government bonds.
(d) Investments in corporate bonds, mortgage-backed securities and passively managed index funds with holdings in long-term corporate
bonds.
(e) Investments in equities, nominal and inflation-linked fixed income securities, commodities and public real estate.
(f) Includes venture capital, mezzanine and high-yield debt, natural resources and timberland funds.
(g) Investments in multi-strategy hedge funds (including domestic and international equity securities, convertible bonds and other alternative
investments), real estate and derivative investments.
(h) Represents $20 million in contributions to equity securities and $65 million in contributions to balanced funds held by investment managers,
but not yet invested in the respective funds as of January 29, 2011.
Actual return on plan assets (a)
Level 3 Reconciliation
Relating to Relating to
Balance at assets still held assets sold Purchases, Transfers in
beginning of at the reporting during the sales and and/or out of Balance at
(millions) period date period settlements Level 3 end of period
2009
Private equity funds $317 $ 19 $ 1 $ (1) $ — $336
Other 131 (20) — 8 — 119
2010
Private equity funds $336 $ 28 $12 $(49) $ — $327
Other 119 7 2 (1) — 127
(a) Represents realized and unrealized gains (losses) from changes in values of those financial instruments only for the period in which the
instruments were classified as Level 3.
62