Target 2010 Annual Report Download - page 75
Download and view the complete annual report
Please find page 75 of the 2010 Target annual report below. You can navigate through the pages in the report by either clicking on the pages listed below, or by using the keyword search tool below to find specific information within the annual report.-
 1
1 -
2
-
3
-
4
-
5
-
6
-
7
-
8
-
9
-
10
-
11
-
12
-
13
-
14
-
15
-
16
-
17
-
18
-
19
-
20
-
21
-
22
-
23
-
24
-
25
-
26
-
27
-
28
-
29
-
30
-
31
-
32
-
33
-
34
-
35
-
36
-
37
-
38
-
39
-
40
-
41
-
42
-
43
-
44
-
45
-
46
-
47
-
48
-
49
-
50
-
51
-
52
-
53
-
54
-
55
-
56
-
57
-
58
-
59
-
60
-
61
-
62
-
63
-
64
-
 65
65 -
 66
66 -
 67
67 -
 68
68 -
 69
69 -
 70
70 -
 71
71 -
 72
72 -
 73
73 -
 74
74 -
 75
75 -
 76
76 -
 77
77 -
 78
78 -
 79
79 -
 80
80 -
 81
81 -
 82
82 -
 83
83 -
 84
84 -
 85
85 -
86
-
87
-
88
-
89
-
90
-
91
-
92
-
93
-
94
-
95
-
96
-
97
-
98
-
99
-
100
-
101
-
102
-
103
 |
 |

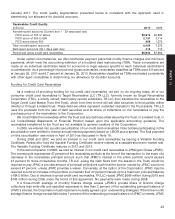
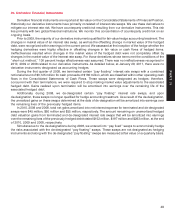
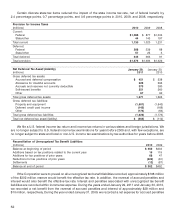
and interest of approximately $33 million. We had accrued for the payment of interest and penalties of
approximately $95 million at January 29, 2011 and $127 million at January 30, 2010.
The January 30, 2010 liability for uncertain tax positions included $133 million for tax positions for which the
ultimate deductibility was highly certain, but for which there was uncertainty about the timing of such deductibility.
During 2010, we filed a tax accounting method change that resolved the uncertainty surrounding the timing of
deductions for these tax positions, resulting in a $133 million decrease to our unrecognized tax benefit liability and
no impact on income tax expense in 2010.
In addition, we resolved various state income tax matters in 2010, resulting in a reduction of approximately
$80 million to our unrecognized tax benefit liability, which also reduced tax expense in 2010. It is reasonably
possible that the amount of the unrecognized tax benefit liabilities with respect to our other unrecognized tax
positions will increase or decrease during the next twelve months; however an estimate of the amount or range of
the change cannot be made at this time.
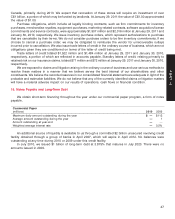
During 2009, we filed income tax returns that included tax accounting method changes allowed under
applicable tax regulations. These changes resulted in a substantial increase in tax deductions related to property
and equipment, resulting in an increase in noncurrent deferred income tax liabilities of approximately $300 million
and a corresponding increase in current income taxes receivable, which is classified as other current assets in the
Consolidated Statements of Financial Position. These changes did not affect income tax expense for 2009.
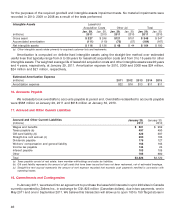
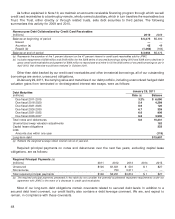
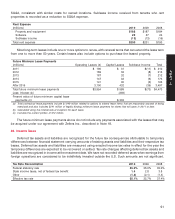
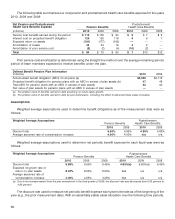
23. Other Noncurrent Liabilities
Other Noncurrent Liabilities January 29, January 30,
(millions) 2011 2010
General liability and workers’ compensation (a) $ 470 $ 490
Deferred compensation 396 353
Income tax 313 579
Pension and postretirement health care benefits 128 178
Other 300 306
Total $1,607 $1,906
(a) We retain a substantial portion of the risk related to certain general liability and workers’ compensation claims. Liabilities associated with
these losses include estimates of both claims filed and losses incurred but not yet reported. We estimate our ultimate cost based on
analysis of historical data and actuarial estimates. General liability and workers’ compensation liabilities are recorded at our estimate of their
net present value.
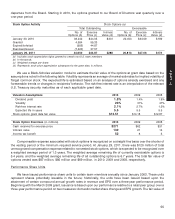
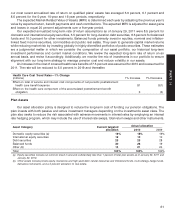
24. Share Repurchase
In November 2007, our Board of Directors approved a share repurchase program totaling $10 billion that
replaced a prior program. In November 2008, we announced that, in light of our business outlook, we were
temporarily suspending our open-market share repurchase program. In January 2010, we resumed open-market
purchases of shares under this program.
Share repurchases for the last three years, repurchased primarily through open market transactions, were as
follows:
Share Repurchases Total Number of Average Price
(millions, except per share data) Shares Purchased Paid per Share Total Investment
2008 67.2 $50.49 $3,395
2009 9.9 48.54 479
2010 47.8 52.44 2,508
Total 124.9 $51.08 $6,382
53
PART II