Target 2010 Annual Report Download - page 37
Download and view the complete annual report
Please find page 37 of the 2010 Target annual report below. You can navigate through the pages in the report by either clicking on the pages listed below, or by using the keyword search tool below to find specific information within the annual report.-
 1
1 -
2
-
3
-
4
-
5
-
6
-
7
-
8
-
9
-
10
-
11
-
12
-
13
-
14
-
15
-
16
-
17
-
18
-
19
-
20
-
21
-
22
-
23
-
24
-
25
-
26
-
 27
27 -
 28
28 -
 29
29 -
 30
30 -
 31
31 -
 32
32 -
 33
33 -
 34
34 -
 35
35 -
 36
36 -
 37
37 -
 38
38 -
 39
39 -
 40
40 -
 41
41 -
 42
42 -
 43
43 -
 44
44 -
 45
45 -
 46
46 -
 47
47 -
48
-
49
-
50
-
51
-
52
-
53
-
54
-
55
-
56
-
57
-
58
-
59
-
60
-
61
-
62
-
63
-
64
-
65
-
66
-
67
-
68
-
69
-
70
-
71
-
72
-
73
-
74
-
75
-
76
-
77
-
78
-
79
-
80
-
81
-
82
-
83
-
84
-
85
-
86
-
87
-
88
-
89
-
90
-
91
-
92
-
93
-
94
-
95
-
96
-
97
-
98
-
99
-
100
-
101
-
102
-
103
 |
 |

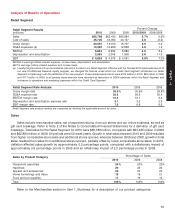
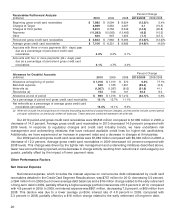
Analysis of Results of Operations
Retail Segment
Percent Change
Retail Segment Results
(millions) 2010 2009 2008 2010/2009 2009/2008
Sales $65,786 $63,435 $62,884 3.7% 0.9%
Cost of sales 45,725 44,062 44,157 3.8 (0.2)
Gross margin 20,061 19,373 18,727 3.5 3.5
SG&A expenses (a) 13,367 12,989 12,838 2.9 1.2
EBITDA 6,694 6,384 5,889 4.9 8.4
Depreciation and amortization 2,065 2,008 1,808 2.8 11.0
EBIT $ 4,629 $ 4,376 $ 4,081 5.8% 7.3%
EBITDA is earnings before interest expense, income taxes, depreciation and amortization.
EBIT is earnings before interest expense and income taxes.
(a) Loyalty Program discounts are recorded as reductions to sales in our Retail Segment. Effective with the October 2010 nationwide launch of
our new 5% REDcard Rewards loyalty program, we changed the formula under which our Credit Card segment reimburses our Retail
Segment to better align with the attributes of the new program. These reimbursed amounts were $102 million in 2010, $89 million in 2009
and $117 million in 2008. In all periods these amounts were recorded as reductions to SG&A expenses within the Retail Segment and
increases to operations and marketing expenses within the Credit Card Segment.
Retail Segment Rate Analysis 2010 2009 2008
Gross margin rate 30.5% 30.5% 29.8%
SG&A expense rate 20.3 20.5 20.4
EBITDA margin rate 10.2 10.1 9.4
Depreciation and amortization expense rate 3.1 3.2 2.9
EBIT margin rate 7.0 6.9 6.5
Retail Segment rate analysis metrics are computed by dividing the applicable amount by sales.
Sales
Sales include merchandise sales, net of expected returns, from our stores and our online business, as well as
gift card breakage. Refer to Note 2 of the Notes to Consolidated Financial Statements for a definition of gift card
breakage. Total sales for the Retail Segment for 2010 were $65,786 million, compared with $63,435 million in 2009
and $62,884 million in 2008. All periods were 52-week years. Growth in total sales between 2010 and 2009 resulted
from higher comparable-store sales and additional stores opened, whereas between 2009 and 2008, growth in total
sales resulted from sales from additional stores opened, partially offset by lower comparable-store sales. In 2010,
deflation affected sales growth by approximately 0.2 percentage points, compared with a deflationary impact of
approximately 3.6 percentage points in 2009 and an inflationary impact of 2.2 percentage points in 2008.
Percentage of Sales
Sales by Product Category
2010 2009 2008
Household essentials 24% 23% 22%
Hardlines 20 22 22
Apparel and accessories 20 20 20
Home furnishings and d´
ecor 19 19 21
Food and pet supplies 17 16 15
Total 100% 100% 100%
Refer to the Merchandise section in Item 1, Business, for a description of our product categories.
15
PART II