Target 2010 Annual Report Download - page 77
Download and view the complete annual report
Please find page 77 of the 2010 Target annual report below. You can navigate through the pages in the report by either clicking on the pages listed below, or by using the keyword search tool below to find specific information within the annual report.-
 1
1 -
2
-
3
-
4
-
5
-
6
-
7
-
8
-
9
-
10
-
11
-
12
-
13
-
14
-
15
-
16
-
17
-
18
-
19
-
20
-
21
-
22
-
23
-
24
-
25
-
26
-
27
-
28
-
29
-
30
-
31
-
32
-
33
-
34
-
35
-
36
-
37
-
38
-
39
-
40
-
41
-
42
-
43
-
44
-
45
-
46
-
47
-
48
-
49
-
50
-
51
-
52
-
53
-
54
-
55
-
56
-
57
-
58
-
59
-
60
-
61
-
62
-
63
-
64
-
65
-
66
-
 67
67 -
 68
68 -
 69
69 -
 70
70 -
 71
71 -
 72
72 -
 73
73 -
 74
74 -
 75
75 -
 76
76 -
 77
77 -
 78
78 -
 79
79 -
 80
80 -
 81
81 -
 82
82 -
 83
83 -
 84
84 -
 85
85 -
 86
86 -
 87
87 -
88
-
89
-
90
-
91
-
92
-
93
-
94
-
95
-
96
-
97
-
98
-
99
-
100
-
101
-
102
-
103
 |
 |

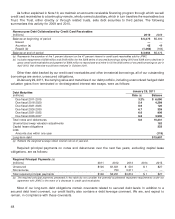
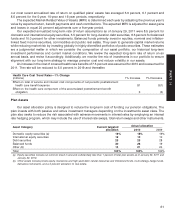
departure from the Board. Starting in 2010, the options granted to our Board of Directors vest quarterly over a
one-year period.
Stock Option Activity Stock Options (a)
Total Outstanding Exercisable
No. of Exercise Intrinsic No. of Exercise Intrinsic
Options (b) Price (c) Value (d) Options (b) Price (c) Value (d)
January 30, 2010 38,242 $44.05 $331 22,453 $44.59 $189
Granted 4,584 55.33
Expired/forfeited (956) 44.87
Exercised/issued (7,220) 37.57
January 29, 2011 34,650 $46.87 $288 20,813 $47.06 $172
(a) Includes stock appreciation rights granted to certain non-U.S. team members.
(b) In thousands.
(c) Weighted average per share.
(d) Represents stock price appreciation subsequent to the grant date, in millions.
We use a Black-Scholes valuation model to estimate the fair value of the options at grant date based on the
assumptions noted in the following table. Volatility represents an average of market estimates for implied volatility of
Target common stock. The expected life is estimated based on an analysis of options already exercised and any
foreseeable trends or changes in recipients’ behavior. The risk-free interest rate is an interpolation of the relevant
U.S. Treasury security maturities as of each applicable grant date.
Valuation Assumptions 2010 2009 2008
Dividend yield 1.8% 1.4% 1.9%
Volatility 26% 31% 47%
Risk-free interest rate 2.1% 2.7% 1.5%
Expected life in years 5.5 5.5 5.5
Stock options grant date fair value $12.51 $14.18 $12.87
Stock Option Exercises (in millions) 2010 2009 2008
Cash received for exercise price $271 $62 $31
Intrinsic value 132 21 14
Income tax benefit 52 85
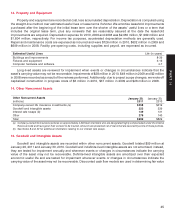
Compensation expense associated with stock options is recognized on a straight-line basis over the shorter of
the vesting period or the minimum required service period. At January 29, 2011, there was $120 million of total
unrecognized compensation expense related to nonvested stock options, which is expected to be recognized over
a weighted average period of 1.3 years. The weighted average remaining life of currently exercisable options is
5.4 years, and the weighted average remaining life of all outstanding options is 6.7 years. The total fair value of
options vested was $87 million, $85 million and $69 million, in 2010, 2009 and 2008, respectively.
Performance Share Units
We have issued performance share units to certain team members annually since January 2003. These units
represent shares potentially issuable in the future; historically, the units have been issued based upon the
attainment of certain compound annual growth rates in revenue and EPS over a three-year performance period.
Beginning with the March 2009 grant, issuance is based upon our performance relative to a retail peer group over a
three-year performance period on two measures: domestic market share change and EPS growth. The fair value of
55
PART II