Target 2010 Annual Report Download - page 66
Download and view the complete annual report
Please find page 66 of the 2010 Target annual report below. You can navigate through the pages in the report by either clicking on the pages listed below, or by using the keyword search tool below to find specific information within the annual report.-
 1
1 -
2
-
3
-
4
-
5
-
6
-
7
-
8
-
9
-
10
-
11
-
12
-
13
-
14
-
15
-
16
-
17
-
18
-
19
-
20
-
21
-
22
-
23
-
24
-
25
-
26
-
27
-
28
-
29
-
30
-
31
-
32
-
33
-
34
-
35
-
36
-
37
-
38
-
39
-
40
-
41
-
42
-
43
-
44
-
45
-
46
-
47
-
48
-
49
-
50
-
51
-
52
-
53
-
54
-
55
-
 56
56 -
 57
57 -
 58
58 -
 59
59 -
 60
60 -
 61
61 -
 62
62 -
 63
63 -
 64
64 -
 65
65 -
 66
66 -
 67
67 -
 68
68 -
 69
69 -
 70
70 -
 71
71 -
 72
72 -
 73
73 -
 74
74 -
 75
75 -
 76
76 -
77
-
78
-
79
-
80
-
81
-
82
-
83
-
84
-
85
-
86
-
87
-
88
-
89
-
90
-
91
-
92
-
93
-
94
-
95
-
96
-
97
-
98
-
99
-
100
-
101
-
102
-
103
 |
 |

may compel the Corporation to implement underwriting and collections activities, provided those activities are
compatible with the Corporation’s systems, as well as consistent with similar credit card receivable portfolios
managed by JPMC. If the Corporation fails to implement the activities, JPMC has the right to cause the accelerated
repayment of the note payable issued in the transaction. As noted in the preceding paragraph, payments would be
made solely from the Trust assets.
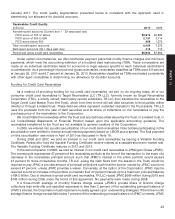
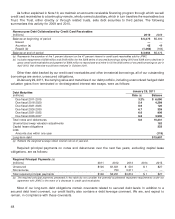
All interests in our Credit Card Receivables issued by the Trust are accounted for as secured borrowings.
Interest and principal payments are satisfied provided the cash flows from the Trust assets are sufficient and are
nonrecourse to the general assets of the Corporation. If the cash flows are less than the periodic interest, the
available amount, if any, is paid with respect to interest. Interest shortfalls will be paid to the extent subsequent cash
flows from the assets in the Trust are sufficient. Future principal payments will be made from the third party’s prorata
share of cash flows from the Trust assets.
2010 2009
Securitized Borrowings
(millions) Debt Balance Collateral Debt Balance Collateral
2008 Series (a) $2,954 $3,061 $3,475 $3,652
2006/2007 Series 1,000 1,266 1,000 1,266
2005 Series —— 900 1,154
Total $3,954 $4,327 $5,375 $6,072
(a) The debt balance for the 2008 Series is net of a 7% discount from JPMC. The unamortized portion of this discount was $107 million and
$177 million as of January 29, 2011, and January 30, 2010, respectively.
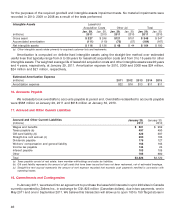
11. Inventory
Substantially our entire inventory and the related cost of sales are accounted for under the retail inventory
accounting method (RIM) using the last-in, first-out (LIFO) method. Inventory is stated at the lower of LIFO cost or
market. Cost includes purchase price as reduced by vendor income. Inventory is also reduced for estimated losses
related to shrink and markdowns. The LIFO provision is calculated based on inventory levels, markup rates and
internally measured retail price indices.
Under RIM, inventory cost and the resulting gross margins are calculated by applying a cost-to-retail ratio to
the retail value inventory. RIM is an averaging method that has been widely used in the retail industry due to its
practicality. The use of RIM will result in inventory being valued at the lower of cost or market because permanent
markdowns are currently taken as a reduction of the retail value of inventory.
We routinely enter into arrangements with vendors whereby we do not purchase or pay for merchandise until
the merchandise is ultimately sold to a guest. Revenues under this program are included in sales in the
Consolidated Statements of Operations, but the merchandise received under the program is not included in
inventory in our Consolidated Statements of Financial Position because of the virtually simultaneous purchase and
sale of this inventory. Sales made under these arrangements totaled $1,581 million in 2010, $1,470 million in 2009
and $1,538 million in 2008.
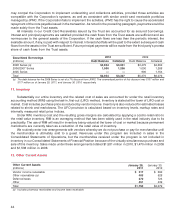
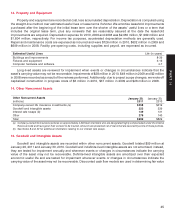
12. Other Current Assets
Other Current Assets January 29, January 30,
(millions) 2011 2010
Vendor income receivable $ 517 $ 390
Other receivables (a) 405 526
Deferred taxes 379 724
Other 451 439
Total $1,752 $2,079
(a) Includes pharmacy receivables and income taxes receivable.
44