Target 2010 Annual Report Download - page 38
Download and view the complete annual report
Please find page 38 of the 2010 Target annual report below. You can navigate through the pages in the report by either clicking on the pages listed below, or by using the keyword search tool below to find specific information within the annual report.-
 1
1 -
2
-
3
-
4
-
5
-
6
-
7
-
8
-
9
-
10
-
11
-
12
-
13
-
14
-
15
-
16
-
17
-
18
-
19
-
20
-
21
-
22
-
23
-
24
-
25
-
26
-
27
-
 28
28 -
 29
29 -
 30
30 -
 31
31 -
 32
32 -
 33
33 -
 34
34 -
 35
35 -
 36
36 -
 37
37 -
 38
38 -
 39
39 -
 40
40 -
 41
41 -
 42
42 -
 43
43 -
 44
44 -
 45
45 -
 46
46 -
 47
47 -
 48
48 -
49
-
50
-
51
-
52
-
53
-
54
-
55
-
56
-
57
-
58
-
59
-
60
-
61
-
62
-
63
-
64
-
65
-
66
-
67
-
68
-
69
-
70
-
71
-
72
-
73
-
74
-
75
-
76
-
77
-
78
-
79
-
80
-
81
-
82
-
83
-
84
-
85
-
86
-
87
-
88
-
89
-
90
-
91
-
92
-
93
-
94
-
95
-
96
-
97
-
98
-
99
-
100
-
101
-
102
-
103
 |
 |

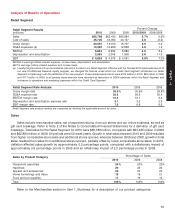
Comparable-store sales is a measure that indicates the performance of our existing stores by measuring the
growth in sales for such stores for a period over the comparable, prior-year period of equivalent length. The method
of calculating comparable-store sales varies across the retail industry. As a result, our comparable-store sales
calculation is not necessarily comparable to similarly titled measures reported by other companies.
Comparable-store sales are sales from our online business and stores open longer than one year, including:
• sales from stores that have been remodeled or expanded while remaining open
• sales from stores that have been relocated to new buildings of the same format within the same trade area, in
which the new store opens at about the same time as the old store closes
Comparable-store sales do not include:
• sales from general merchandise stores that have been converted, or relocated within the same trade area, to
a SuperTarget store format
• sales from stores that were intentionally closed to be remodeled, expanded or reconstructed
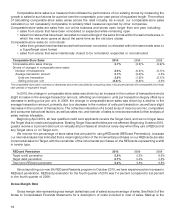
Comparable-Store Sales 2010 2009 2008
Comparable-store sales change 2.1% (2.5)% (2.9)%
Drivers of changes in comparable-store sales:
Number of transactions 2.0% (0.2)% (3.1)%
Average transaction amount 0.1% (2.3)% 0.2%
Units per transaction 2.5% (1.5)% (2.1)%
Selling price per unit (2.3)% (0.8)% 2.3%
The comparable-store sales increases or decreases above are calculated by comparing sales in fiscal year periods with comparable prior fiscal
year periods of equivalent length.
In 2010, the change in comparable-store sales was driven by an increase in the number of transactions and a
slight increase in the average transaction amount, reflecting an increase in units per transaction largely offset by a
decrease in selling price per unit. In 2009, the change in comparable-store sales was driven by a decline in the
average transaction amount, primarily due to a decrease in the number of units per transaction, as well as a slight
decrease in the number of transactions. The collective interaction of a broad array of macroeconomic, competitive
and consumer behavioral factors, as well as sales mix, and transfer of sales to new stores makes further analysis of
sales metrics infeasible.
Beginning April 2010, all new qualified credit card applicants receive the Target Card, and we no longer issue
the Target Visa to credit card applicants. Existing Target Visa cardholders are not affected. Beginning October 2010,
guests receive a 5 percent discount on virtually all purchases at checkout every day when they use a REDcard at
any Target store or on Target.com.
We monitor the percentage of store sales that are paid for using REDcards (REDcard Penetration), because
our internal analysis has indicated that a meaningful portion of the incremental purchases on our REDcards are also
incremental sales for Target, with the remainder of the incremental purchases on the REDcards representing a shift
in tender type.
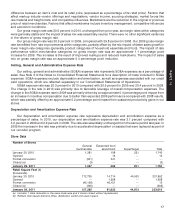
REDcard Penetration 2010 2009 2008
Target credit penetration 5.2% 5.2% 6.2%
Target debit penetration 0.7% 0.4% 0.3%
Total store REDcard penetration 5.9% 5.6% 6.5%
Since launching our new 5% REDcard Rewards program in October 2010, we have experienced an increase in
REDcard penetration. REDcard penetration for the fourth quarter of 2010 was 7.4 percent compared to 5.6 percent
in the fourth quarter of 2009.
Gross Margin Rate
Gross margin rate represents gross margin (sales less cost of sales) as a percentage of sales. See Note 3 of the
Notes to Consolidated Financial Statements for a description of costs included in cost of sales. Markup is the
16