Target 2010 Annual Report Download - page 60
Download and view the complete annual report
Please find page 60 of the 2010 Target annual report below. You can navigate through the pages in the report by either clicking on the pages listed below, or by using the keyword search tool below to find specific information within the annual report.-
 1
1 -
2
-
3
-
4
-
5
-
6
-
7
-
8
-
9
-
10
-
11
-
12
-
13
-
14
-
15
-
16
-
17
-
18
-
19
-
20
-
21
-
22
-
23
-
24
-
25
-
26
-
27
-
28
-
29
-
30
-
31
-
32
-
33
-
34
-
35
-
36
-
37
-
38
-
39
-
40
-
41
-
42
-
43
-
44
-
45
-
46
-
47
-
48
-
49
-
 50
50 -
 51
51 -
 52
52 -
 53
53 -
 54
54 -
 55
55 -
 56
56 -
 57
57 -
 58
58 -
 59
59 -
 60
60 -
 61
61 -
 62
62 -
 63
63 -
 64
64 -
 65
65 -
 66
66 -
 67
67 -
 68
68 -
 69
69 -
 70
70 -
71
-
72
-
73
-
74
-
75
-
76
-
77
-
78
-
79
-
80
-
81
-
82
-
83
-
84
-
85
-
86
-
87
-
88
-
89
-
90
-
91
-
92
-
93
-
94
-
95
-
96
-
97
-
98
-
99
-
100
-
101
-
102
-
103
 |
 |

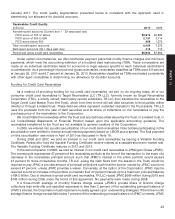
Target Debit Card. This new REDcard Rewards program replaced the existing rewards program in which account
holders received an initial 10 percent-off coupon for opening the account and earned points toward a 10 percent-off
coupon on subsequent purchases. These changes are intended to simplify the program and to generate profitable
incremental retail sales. The discounts associated with our REDcard Rewards program are included as reductions
in sales in our Consolidated Statements of Operations and were $162 million in 2010, $94 million in 2009 and
$114 million in 2008.
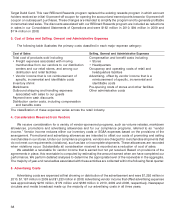
3. Cost of Sales and Selling, General and Administrative Expenses
The following table illustrates the primary costs classified in each major expense category:
Cost of Sales Selling, General and Administrative Expenses
Total cost of products sold including Compensation and benefit costs including
• Freight expenses associated with moving • Stores
merchandise from our vendors to our distribution • Headquarters
centers and our retail stores, and among our Occupancy and operating costs of retail and
distribution and retail facilities headquarters facilities
• Vendor income that is not reimbursement of Advertising, offset by vendor income that is a
specific, incremental and identifiable costs reimbursement of specific, incremental and
Inventory shrink identifiable costs
Markdowns Pre-opening costs of stores and other facilities
Outbound shipping and handling expenses Other administrative costs
associated with sales to our guests
Payment term cash discounts
Distribution center costs, including compensation
and benefits costs
The classification of these expenses varies across the retail industry.
4. Consideration Received from Vendors
We receive consideration for a variety of vendor-sponsored programs, such as volume rebates, markdown
allowances, promotions and advertising allowances and for our compliance programs, referred to as ‘‘vendor
income.’’ Vendor income reduces either our inventory costs or SG&A expenses based on the provisions of the
arrangement. Promotional and advertising allowances are intended to offset our costs of promoting and selling
merchandise in our stores. Under our compliance programs, vendors are charged for merchandise shipments that
do not meet our requirements (violations), such as late or incomplete shipments. These allowances are recorded
when violations occur. Substantially all consideration received is recorded as a reduction of cost of sales.
We establish a receivable for vendor income that is earned but not yet received. Based on provisions of the
agreements in place, this receivable is computed by estimating the amount earned when we have completed our
performance. We perform detailed analyses to determine the appropriate level of the receivable in the aggregate.
The majority of year-end receivables associated with these activities are collected within the following fiscal quarter.
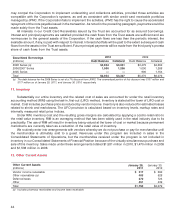
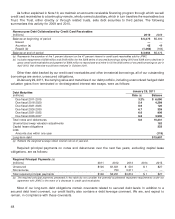
5. Advertising Costs
Advertising costs are expensed at first showing or distribution of the advertisement and were $1,292 million in
2010, $1,167 million in 2009 and $1,233 million in 2008. Advertising vendor income that offset advertising expenses
was approximately $216 million, $179 million and $188 million in 2010, 2009 and 2008, respectively. Newspaper
circulars and media broadcast made up the majority of our advertising costs in all three years.
38