Verizon Wireless 2013 Annual Report Download - page 11
Download and view the complete annual report
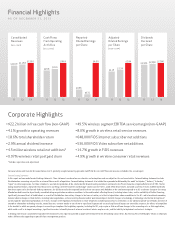
Please find page 11 of the 2013 Verizon Wireless annual report below. You can navigate through the pages in the report by either clicking on the pages listed below, or by using the keyword search tool below to find specific information within the annual report.-
 1
1 -
 2
2 -
 3
3 -
 4
4 -
 5
5 -
 6
6 -
 7
7 -
 8
8 -
 9
9 -
 10
10 -
 11
11 -
 12
12 -
 13
13 -
 14
14 -
 15
15 -
 16
16 -
 17
17 -
 18
18 -
 19
19 -
 20
20 -
 21
21 -
 22
22 -
23
-
24
-
25
-
26
-
27
-
28
-
29
-
30
-
31
-
32
-
33
-
34
-
35
-
36
-
37
-
38
-
39
-
40
-
41
-
42
-
43
-
44
-
45
-
46
-
47
-
48
-
49
-
50
-
51
-
52
-
53
-
54
-
55
-
56
-
57
-
58
-
59
-
60
-
61
-
62
-
63
-
64
-
65
-
66
-
67
-
68
-
69
-
70
-
71
-
72
-
73
-
74
-
75
-
76
 |
 |
9
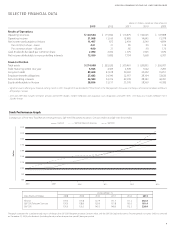
SELECTED FINANCIAL DATA
VERIZON COMMUNICATIONS INC. AND SUBSIDIARIES
Verizon S&P 500 Telecom Services S&P 500
Stock Performance Graph
$120
$100
$80
$60
$220
$160
$180
$200
$140
$240
Dollars
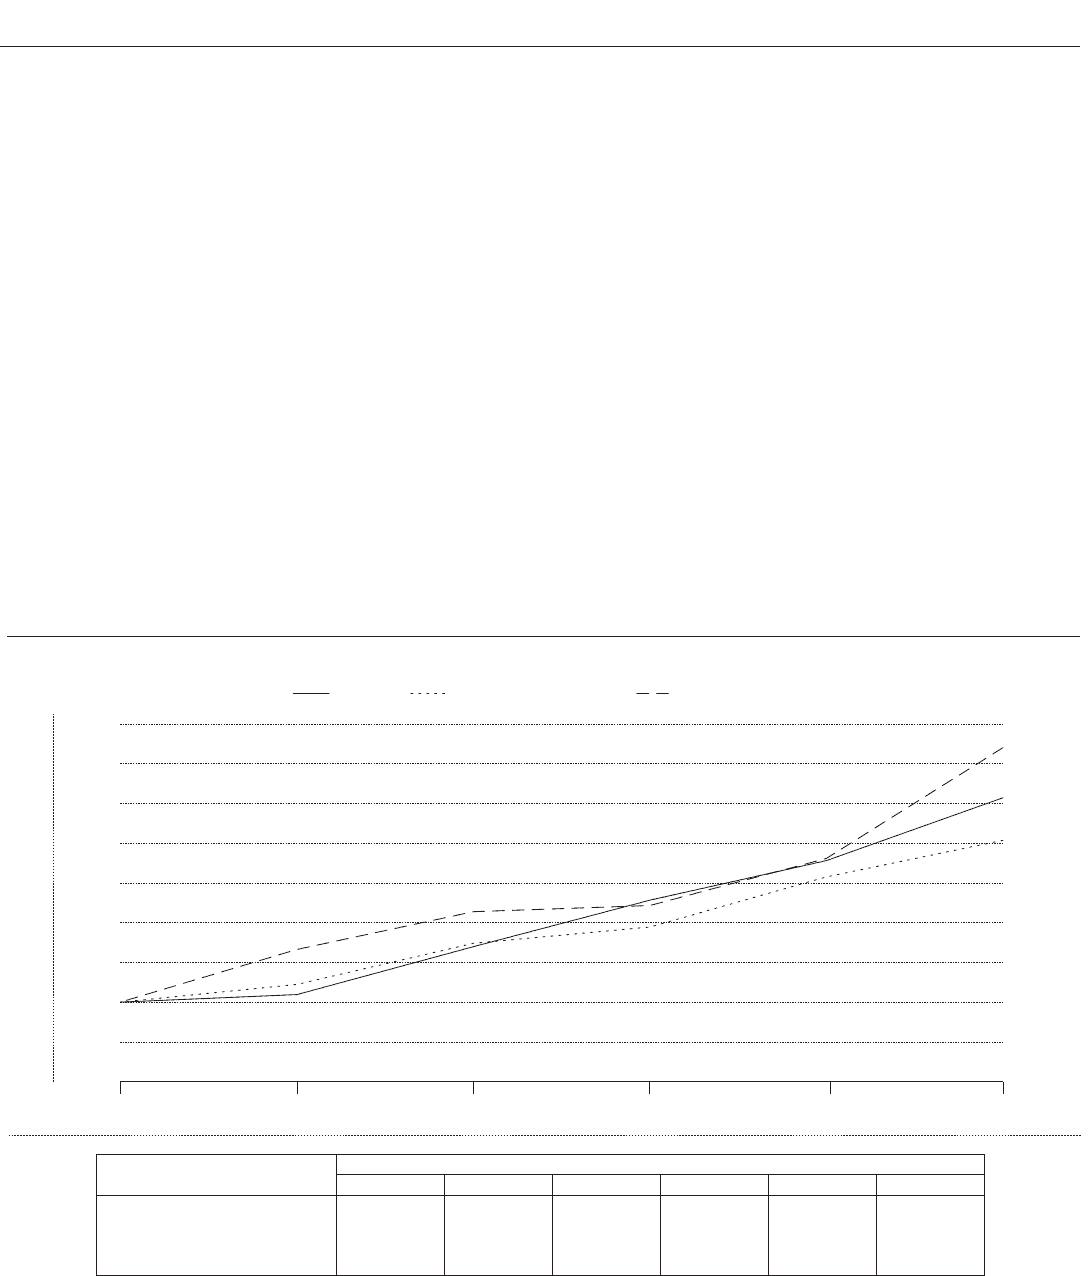
Comparison of Five-Year Total Return Among Verizon, S&P 500 Telecommunications Services Index and S&P 500 Stock Index
2008 2009 2010 2011 2012 2013
The graph compares the cumulative total returns of Verizon, the S&P 500 Telecommunications Services Index, and the S&P 500 Stock Index over a five-year period. It assumes $100 was invested
on December 31, 2008 with dividends (including the value of each respective spin-off ) being reinvested.
Data Points in Dollars
At December 31,
2008 2009 2010 2011 2012 2013
Verizon 100.0 103.8 127.9 151.3 171.2 202.8
S&P 500 Telecom Services 100.0 108.9 129.6 137.8 163.0 181.4
S&P 500 100.0 126.5 145.5 148.6 172.3 228.0
(dollars in millions, except per share amounts)
2013 2012 2011 2010 2009
Results of Operations
Operating revenues $ 120,550 $ 115,846 $ 110,875 $ 106,565 $ 107,808
Operating income 31,968 13,160 12,880 14,645 15,978
Net income attributable to Verizon 11,497 875 2,404 2,549 4,894
Per common share – basic 4.01 .31 .85 .90 1.72
Per common share – diluted 4.00 .31 .85 .90 1.72
Cash dividends declared per common share 2.090 2.030 1.975 1.925 1.870
Net income attributable to noncontrolling interests 12,050 9,682 7,794 7,668 6,707
Financial Position
Total assets $ 274,098 $ 225,222 $ 230,461 $ 220,005 $ 226,907
Debt maturing within one year 3,933 4,369 4,849 7,542 7,205
Long-term debt 89,658 47,618 50,303 45,252 55,051
Employee benet obligations 27,682 34,346 32,957 28,164 32,622
Noncontrolling interests 56,580 52,376 49,938 48,343 42,761
Equity attributable to Verizon 38,836 33,157 35,970 38,569 41,382
• Significanteventsaffectingourhistoricalearningstrendsin2011through2013aredescribedin“OtherItems”inthe“Management’sDiscussionandAnalysisofFinancialConditionandResults
ofOperations”section.
• 2010 and 2009 data includes severance, pension and benefit charges, merger integration and acquisition costs, dispositions and other items. 2010 data also includes Medicare Part D
Subsidy charges.