Verizon Wireless 2013 Annual Report Download - page 20
Download and view the complete annual report
Please find page 20 of the 2013 Verizon Wireless annual report below. You can navigate through the pages in the report by either clicking on the pages listed below, or by using the keyword search tool below to find specific information within the annual report.-
 1
1 -
2
-
3
-
4
-
5
-
6
-
7
-
8
-
9
-
 10
10 -
 11
11 -
 12
12 -
 13
13 -
 14
14 -
 15
15 -
 16
16 -
 17
17 -
 18
18 -
 19
19 -
 20
20 -
 21
21 -
 22
22 -
 23
23 -
 24
24 -
 25
25 -
 26
26 -
 27
27 -
 28
28 -
 29
29 -
 30
30 -
31
-
32
-
33
-
34
-
35
-
36
-
37
-
38
-
39
-
40
-
41
-
42
-
43
-
44
-
45
-
46
-
47
-
48
-
49
-
50
-
51
-
52
-
53
-
54
-
55
-
56
-
57
-
58
-
59
-
60
-
61
-
62
-
63
-
64
-
65
-
66
-
67
-
68
-
69
-
70
-
71
-
72
-
73
-
74
-
75
-
76
 |
 |
18
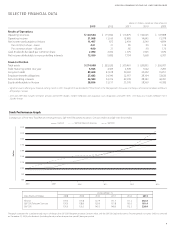
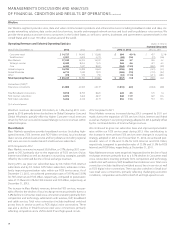
2013 Compared to 2012
TheincreaseinWireless’totaloperatingrevenuesof$5.2billion,or6.8%,
during 2013 compared to 2012 was primarily the result of growth in ser-
vice revenue.
Accounts and Connections
Retail (non-wholesale)postpaid accountsrepresentretailcustomers
under contract with Verizon Wireless that are directly served and man-
aged by Verizon Wireless and use its branded services. Accounts include
Share Everything plans and corporate accounts, as well as legacy single
connection plans and family plans. A single account may receive monthly
wirelessservicesforavarietyofconnecteddevices.Retailconnections
represent our retail customer device connections. Churn is the rate at
which service to connections is terminated.
Retailconnectionsunderanaccountmayincludesmartphones,basic
phones, tablets and other Internet devices, as well as Home Phone
ConnectandHomeFusion.Weexpecttocontinuetoexperienceretail
connection growth based on the strength of our product offerings
andnetworkservicequality.Retailpostpaidconnectionnetadditions
decreased during 2013 compared to 2012 primarily due to an increase in
our retail postpaid connection churn rate, partially oset by an increase
in retail postpaid connection gross additions.
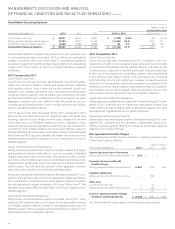
Retail Postpaid Connections per Account
Retailpostpaidconnectionsperaccountiscalculatedbydividingthe
total number of retail postpaid connections by the number of retail
postpaidaccountsasoftheendoftheperiod.Retailpostpaidconnec-
tions per account increased 4.5% as of December 31, 2013 compared to
December 31, 2012 primarily due to the increased penetration of tablets
and other Internet devices.
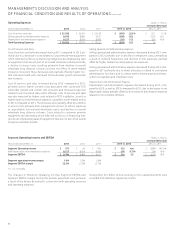
Service Revenue
Service revenue increased $5.3 billion, or 8.3%, during 2013 compared
to 2012 primarily driven by higher retail postpaid service revenue, which
increased largely as a result of an increase in retail postpaid connections
as well as the continued increase in penetration of smartphones, tab-
lets and other Internet devices through our Share Everything plans. The
penetration of smartphones was driven by the activation of smartphones
by new customers as well as existing customers migrating from basic
phones to smartphones.
TheincreaseinretailpostpaidARPA(theaveragerevenueperaccount
from retail postpaid accounts) during 2013 compared to 2012 was pri-
marily driven by increases in smartphone penetration and retail postpaid
connections per account. As of December 31, 2013, we experienced a
4.5% increase in retail postpaid connections per account compared to
2012, with smartphones representing 70% of our retail postpaid phone
base as of December 31, 2013 compared to 58% as of December 31, 2012.
The increased penetration in retail postpaid connections per account is
primarily due to increases in Internet data devices, which represented
10.7% of our retail postpaid connection base as of December 31, 2013
compared to 9.3% as of December 31, 2012, primarily due to activations
of tablets and other Internet devices. Additionally, during 2013, postpaid
smartphone activations represented 86% of phones activated compared
to 77% during 2012.
Other service revenue increased during 2013 compared to 2012 due to
growth in wholesale connections, partially oset by a decrease in rev-
enue related to third party roaming.
Equipment and Other Revenue
Equipment and other revenue decreased during 2013 compared to 2012
as a decline in regulatory fees was partially oset by an increase in rev-
enue related to upgrade fees.
2012 Compared to 2011
TheincreaseinWireless’totaloperatingrevenuesduring2012compared
to 2011 was the result of growth in both service and equipment and
other revenue.
Accounts and Connections
Retailconnectionnetadditionsincreasedduring2012comparedto2011
primarily due to an increase in retail postpaid and prepaid connection
gross additions and improvements in our retail connections churn rate.
Higher retail postpaid connection gross additions during 2012 primarily
reected the launch of our Share Everything plans coupled with new
device introductions during the second half of 2012.
Retail Postpaid Connections per Account
Retailpostpaidconnectionsperaccountincreasedduring2012com-
pared to 2011 primarily due to the increased use of tablets and other
Internet devices.
Service Revenue
Service revenue increased during 2012 compared to 2011 primarily
driven by higher retail postpaid service revenue, which increased largely
as a result of an increase in retail postpaid connections of 5.1 million in
2012, as well as the continued increase in penetration of smartphones.
This increased penetration also contributed to the increase in our retail
postpaidARPA.
Theincreaseinretailpostpaid ARPA during2012 comparedto2011
was primarily driven by increases in smartphone penetration and retail
postpaid connections per account. During 2012, we experienced a 4.3%
increase in retail postpaid connections per account compared to 2011,
with smartphones representing 58% of our retail postpaid phone base
as of December 31, 2012 compared to 43.5% as of December 31, 2011.
The increase in retail postpaid connections per account was primarily
due to increases in Internet data devices, which represented 9.3% of our
retail postpaid connection base as of December 31, 2012 compared to
8.1% as of December 31, 2011 primarily due to strong sales of tablets
and Jetpacks™.
Other service revenue decreased during 2012 compared to 2011 pri-
marily as a result of a decrease in third party roaming revenue.
Equipment and Other Revenue
Equipment and other revenue increased during 2012 compared to 2011
primarily due to increases in device upgrade fees, regulatory fees and
equipment sales.
MANAGEMENT’S DISCUSSION AND ANALYSIS
OF FINANCIAL CONDITION AND RESULTS OF OPERATIONS continued