Verizon Wireless 2013 Annual Report Download - page 17
Download and view the complete annual report
Please find page 17 of the 2013 Verizon Wireless annual report below. You can navigate through the pages in the report by either clicking on the pages listed below, or by using the keyword search tool below to find specific information within the annual report.-
 1
1 -
2
-
3
-
4
-
5
-
6
-
 7
7 -
 8
8 -
 9
9 -
 10
10 -
 11
11 -
 12
12 -
 13
13 -
 14
14 -
 15
15 -
 16
16 -
 17
17 -
 18
18 -
 19
19 -
 20
20 -
 21
21 -
 22
22 -
 23
23 -
 24
24 -
 25
25 -
 26
26 -
 27
27 -
28
-
29
-
30
-
31
-
32
-
33
-
34
-
35
-
36
-
37
-
38
-
39
-
40
-
41
-
42
-
43
-
44
-
45
-
46
-
47
-
48
-
49
-
50
-
51
-
52
-
53
-
54
-
55
-
56
-
57
-
58
-
59
-
60
-
61
-
62
-
63
-
64
-
65
-
66
-
67
-
68
-
69
-
70
-
71
-
72
-
73
-
74
-
75
-
76
 |
 |

15
MANAGEMENT’S DISCUSSION AND ANALYSIS
OF FINANCIAL CONDITION AND RESULTS OF OPERATIONS continued
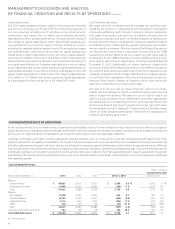
Consolidated Operating Income and EBITDA
Consolidated earnings before interest, taxes, depreciation and amortiza-
tionexpenses(ConsolidatedEBITDA)andConsolidatedAdjustedEBITDA,
which are presented below, are non-GAAP measures and do not purport
to be alternatives to operating income as a measure of operating perfor-
mance.Managementbelievesthatthesemeasuresareusefultoinvestors
and other users of our nancial information in evaluating operating prof-
itability on a more variable cost basis as they exclude the depreciation
and amortization expense related primarily to capital expenditures and
acquisitions that occurred in prior years, as well as in evaluating oper-
atingperformanceinrelationtoourcompetitors.ConsolidatedEBITDA
is calculated by adding back interest, taxes, depreciation and amortiza-
tion expense, equity in earnings of unconsolidated businesses and other
income and (expense), net to net income.
ConsolidatedAdjustedEBITDAiscalculatedbyexcludingtheeectof
non-operational items from the calculation of Consolidated EBITDA.
Managementbelievesthatthismeasureprovidesadditionalrelevantand
useful information to investors and other users of our nancial data in
evaluating the eectiveness of our operations and underlying business
trendsinamannerthatisconsistentwithmanagement’sevaluationof
businessperformance.See“OtherItems”foradditionaldetailsregarding
these non-operational items.
Operatingexpensesincludepensionandbenetrelatedcreditsand/
or charges based on actuarial assumptions, including projected dis-
count rates and an estimated return on plan assets. These estimates are
updated in the fourth quarter to reect actual return on plan assets and
updated actuarial assumptions. The adjustment has been recognized in
the income statement during the fourth quarter or upon a remeasure-
ment event pursuant to our accounting policy for the recognition of
actuarialgains/losses.
Itismanagement’sintenttoprovidenon-GAAPnancialinformationto
enhancetheunderstandingofVerizon’sGAAPnancialinformation,and
it should be considered by the reader in addition to, but not instead of,
the nancial statements prepared in accordance with GAAP. Each non-
GAAP nancial measure is presented along with the corresponding GAAP
measure so as not to imply that more emphasis should be placed on the
non-GAAP measure. The non-GAAP nancial information presented may
be determined or calculated dierently by other companies.
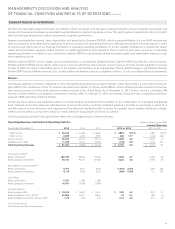
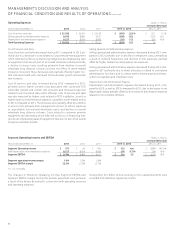
(dollars in millions)
Years Ended December 31, 2013 2012 2011
Consolidated Operating Income $ 31,968 $ 13,160 $ 12,880
Add Depreciation and amortization
expense 16,606 16,460 16,496
Consolidated EBITDA 48,574 29,620 29,376
Add (Less) Non-operating (credits) charges
included in operating expenses (6,510) 7,846 5,954
Consolidated Adjusted EBITDA $ 42,064 $ 37,466 $ 35,330
ThechangesinConsolidatedOperatingIncome,ConsolidatedEBITDA
andConsolidatedAdjustedEBITDAinthetableabovewereprimarilya
result of the factors described in connection with operating revenues
and operating expenses.
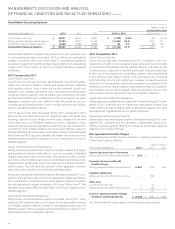
Other Consolidated Results
Equity in Earnings of Unconsolidated Businesses
Equity in earnings of unconsolidated businesses decreased $182 million, or 56.2% in 2013 compared to 2012 primarily due to lower earnings from
operations at Vodafone Omnitel N.V. (Vodafone Omnitel). The decrease during 2013 was partially oset by an immaterial gain recorded by Verizon
Wireless upon obtaining control of previously unconsolidated wireless partnerships, which were previously accounted for under the equity method
and are now consolidated.
Equity in earnings of unconsolidated businesses decreased $120 million, or 27.0%, in 2012 compared to 2011 primarily due to lower earnings from
operations at Vodafone Omnitel and, to a lesser extent, the devaluation of the Euro against the U.S. dollar.
As part of the consideration of the Wireless Transaction, a subsidiary of Verizon sold its entire ownership interest in Vodafone Omnitel to a subsidiary
ofVodafoneonFebruary21,2014.
Other Income and (Expense), Net
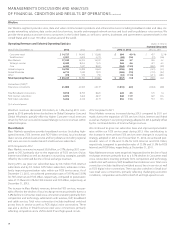
Additional information relating to Other income and (expense), net is as follows:
(dollars in millions)
Increase/(Decrease)
Years Ended December 31, 2013 2012 2011 2013 vs. 2012 2012 vs. 2011
Interest income $ 64 $ 57 $ 68 $ 7 12.3 % $ (11) (16.2) %
Other, net (230) (1,073) (82) 843 (78.6) (991) nm
Total $ (166) $ (1,016) $ (14) $ 850 (83.7) $ (1,002) nm
nm - not meaningful
Other income and (expense), net decreased during 2013 compared to
2012 primarily due to fees of $1.1 billion incurred in 2012 related to the
early redemption of debt, partially oset by $0.2 billion of fees incurred
during the fourth quarter of 2013 as a result of the termination of a bridge
credit agreement upon the eectiveness of a term loan agreement (see
“OtherItems”).
Other income and (expense), net increased during 2012 compared to
2011 primarily driven by higher fees of $1.1 billion related to the early
redemptionofdebt(see“OtherItems”).