Verizon Wireless 2013 Annual Report Download - page 14
Download and view the complete annual report
Please find page 14 of the 2013 Verizon Wireless annual report below. You can navigate through the pages in the report by either clicking on the pages listed below, or by using the keyword search tool below to find specific information within the annual report.-
 1
1 -
2
-
3
-
 4
4 -
 5
5 -
 6
6 -
 7
7 -
 8
8 -
 9
9 -
 10
10 -
 11
11 -
 12
12 -
 13
13 -
 14
14 -
 15
15 -
 16
16 -
 17
17 -
 18
18 -
 19
19 -
 20
20 -
 21
21 -
 22
22 -
 23
23 -
 24
24 -
25
-
26
-
27
-
28
-
29
-
30
-
31
-
32
-
33
-
34
-
35
-
36
-
37
-
38
-
39
-
40
-
41
-
42
-
43
-
44
-
45
-
46
-
47
-
48
-
49
-
50
-
51
-
52
-
53
-
54
-
55
-
56
-
57
-
58
-
59
-
60
-
61
-
62
-
63
-
64
-
65
-
66
-
67
-
68
-
69
-
70
-
71
-
72
-
73
-
74
-
75
-
76
 |
 |

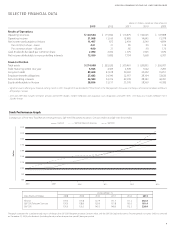
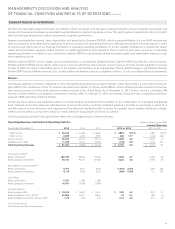
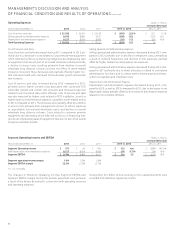
Consolidated Revenues
(dollars in millions)
Increase/(Decrease)
Years Ended December 31, 2013 2012 2011 2013 vs. 2012 2012 vs. 2011
Wireless
Service revenue $ 69,033 $ 63,733 $ 59,157 $ 5,300 8.3 % $ 4,576 7.7 %
Equipment and other 11,990 12,135 10,997 (145) (1.2) 1,138 10.3
Total 81,023 75,868 70,154 5,155 6.8 5,714 8.1
Wireline
MassMarkets 17,328 16,702 16,337 626 3.7 365 2.2
Global Enterprise 14,703 15,299 15,622 (596) (3.9) (323) (2.1)
Global Wholesale 6,714 7,240 7,973 (526) (7.3) (733) (9.2)
Other 478 539 750 (61) (11.3) (211) (28.1)
Total 39,223 39,780 40,682 (557) (1.4) (902) (2.2)
Corporate, eliminations and other 304 198 39 106 53.5 159 nm
Consolidated Revenues $ 120,550 $ 115,846 $ 110,875 $ 4,704 4.1 $ 4,971 4.5
nm - not meaningful
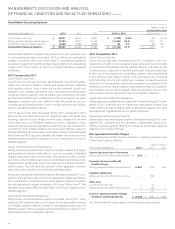
Capital Expenditures
Our 2014 capital program includes capital to fund advanced networks
andservices,including4GLTEandFiOS,thecontinuedexpansionof
our core networks, including our IP and data center enhancements,
maintenance and support for our legacy voice networks and other
expenditures to drive operating eciencies. The level and the timing of
theCompany’scapitalexpenditureswithinthesebroadcategoriescan
vary signicantly as a result of a variety of factors outside our control,
including, for example, material weather events. We are replacing copper
wire with ber-optic cable which will not alter our capital program but
should result in lower maintenance costs in the future. Capital expendi-
tures were $16.6 billion in 2013 and $16.2 billion in 2012, respectively. We
believe that we have signicant discretion over the amount and timing of
our capital expenditures on a Company-wide basis as we are not subject
to any agreement that would require signicant capital expenditures on
a designated schedule or upon the occurrence of designated events. We
expect capital expenditures in 2014 to be in the range of approximately
$16.5 billion to $17.0 billion and we also expect our capital expenditures
as a percentage of revenue to decline in 2014 from 2013 levels.
Cash Flow from Operations
We create value for our shareowners by investing the cash ows gen-
erated by our business in opportunities and transactions that support
continued protable growth, thereby increasing customer satisfaction
and usage of our products and services. In addition, we have used our
cash ows to maintain and grow our dividend payout to shareowners.
Verizon’sBoardofDirectorsincreasedtheCompany’squarterlydividend
by 2.9% during 2013, making this the seventh consecutive year in which
we have raised our dividend. After the closing of the Wireless Transaction,
our Provision for income taxes is expected to increase due to our 100%
ownership of Verizon Wireless. We also expect our cash taxes paid to
increase due to our 100% ownership of Verizon Wireless, and to a much
lesser degree, due to bonus depreciation not being extended beyond
December 31, 2013. Additionally, our Interest expense is expected to
increase as a result of the debt issued to nance the Wireless Transaction.
Asaresultofthesefactors,weexpectCashFlowsfromOperationstobe
negatively impacted in 2014. Partially osetting these negative impacts
toCashFlowsfromOperationswillbethediscontinuationofcashdis-
tributions from Verizon Wireless to Vodafone, which have historically
reducedourCashFlowsfromFinancingActivities.
Our goal is to use our cash to create long-term value for our share-
holders. We will continue to look for investment opportunities that will
help us to grow the business. We expect to use our cash to reduce our
debt levels, pay dividends to our shareholders and, when appropriate,
buybacksharesofouroutstandingcommonstock(see“CashFlowsfrom
FinancingActivities”)andinvestinspectrumlicenses(see“CashFlows
fromInvestingActivities”).During2013,wepurchased3.50millionshares
under our share buyback authorization. There were no repurchases of
common stock during 2012 or 2011.
12
MANAGEMENT’S DISCUSSION AND ANALYSIS
OF FINANCIAL CONDITION AND RESULTS OF OPERATIONS continued
CONSOLIDATED RESULTS OF OPERATIONS
In this section, we discuss our overall results of operations and highlight items of a non-operational nature that are not included in our segment
results. We have two reportable segments, Wireless and Wireline, which we operate and manage as strategic business units and organize by products
andservices.In“SegmentResultsofOperations,”wereviewtheperformanceofourtworeportablesegments.
Corporate, eliminations and other includes unallocated corporate expenses such as certain pension and other employee benet related costs, inter-
segment eliminations recorded in consolidation, the results of other businesses such as our investments in unconsolidated businesses, lease nancing
and other adjustments and gains and losses that are not allocated in assessing segment performance due to their non-operational nature. Although
such transactions are excluded from the business segment results, they are included in reported consolidated earnings. Gains and losses that are not
individuallysignicantareincludedinallsegmentresultsastheseitemsareincludedinthechiefoperatingdecisionmaker’sassessmentofsegment
performance. We believe that this presentation assists users of our nancial statements in better understanding our results of operations and trends
from period to period.