Verizon Wireless 2013 Annual Report Download - page 54
Download and view the complete annual report
Please find page 54 of the 2013 Verizon Wireless annual report below. You can navigate through the pages in the report by either clicking on the pages listed below, or by using the keyword search tool below to find specific information within the annual report.-
 1
1 -
2
-
3
-
4
-
5
-
6
-
7
-
8
-
9
-
10
-
11
-
12
-
13
-
14
-
15
-
16
-
17
-
18
-
19
-
20
-
21
-
22
-
23
-
24
-
25
-
26
-
27
-
28
-
29
-
30
-
31
-
32
-
33
-
34
-
35
-
36
-
37
-
38
-
39
-
40
-
41
-
42
-
43
-
 44
44 -
 45
45 -
 46
46 -
 47
47 -
 48
48 -
 49
49 -
 50
50 -
 51
51 -
 52
52 -
 53
53 -
 54
54 -
 55
55 -
 56
56 -
 57
57 -
 58
58 -
 59
59 -
 60
60 -
 61
61 -
 62
62 -
 63
63 -
 64
64 -
65
-
66
-
67
-
68
-
69
-
70
-
71
-
72
-
73
-
74
-
75
-
76
 |
 |

52
NOTES TO CONSOLIDATED FINANCIAL STATEMENTS continued
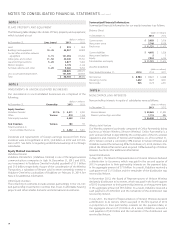
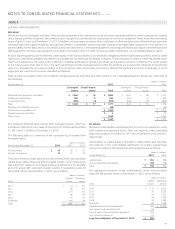
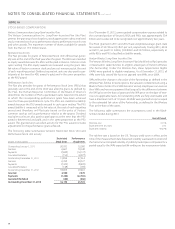
NOTE 8
DEBT
Changes to debt during 2013 are as follows:
(dollars in millions)
Debt Maturing
within One Year
Long-term
Debt Total
Balance at January 1, 2013 $ 4,369 $ 47,618 $ 51,987
Proceeds from long-term borrowings – 49,166 49,166
Repayments of long-term borrowings and capital leases obligations (3,943) (4,220) (8,163)
Decrease in short-term obligations, excluding current maturities (142) – (142)
Reclassications of long-term debt 3,328 (3,328) –
Other 321 422 743
Balance at December 31, 2013 $ 3,933 $ 89,658 $ 93,591
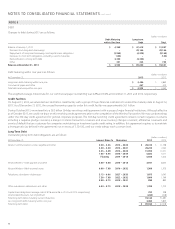
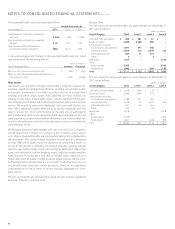
Debt maturing within one year is as follows:
(dollars in millions)
At December 31, 2013 2012
Long-term debt maturing within one year $ 3,486 $ 3,869
Commercial paper and other 447 500
Total debt maturing within one year $ 3,933 $ 4,369
The weighted-average interest rate for our commercial paper outstanding was 0.2% and 0.4% at December 31, 2013 and 2012, respectively.
Credit Facilities
On August 13, 2013, we amended our $6.2 billion credit facility with a group of major nancial institutions to extend the maturity date to August 12,
2017. As of December 31, 2013, the unused borrowing capacity under this credit facility was approximately $6.1 billion.
During October 2013, we entered into a $2.0 billion 364-day revolving credit agreement with a group of major nancial institutions. Although eective
as of October 2013, we could not draw on this revolving credit agreement prior to the completion of the Wireless Transaction. We may use borrowings
under the 364-day credit agreement for general corporate purposes. The 364-day revolving credit agreement contains certain negative covenants,
including a negative pledge covenant, a merger or similar transaction covenant and an accounting changes covenant, armative covenants and
events of default that are customary for companies maintaining an investment grade credit rating. In addition, this agreement requires us to maintain
a leverage ratio (as dened in the agreement) not in excess of 3.50:1.00, until our credit ratings reach a certain level.
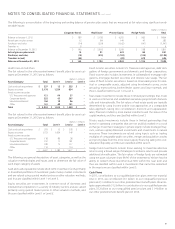
Long-Term Debt
Outstanding long-term debt obligations are as follows:
(dollars in millions)
At December 31, Interest Rates % Maturities 2013 2012
Verizon Communications–notes payable and other 0.50 – 3.85 2014 – 2042 $ 20,416 $ 11,198
4.50 – 5.50 2015 – 2041 20,226 7,062
5.55 – 6.90 2016 – 2043 31,965 11,031
7.35 – 8.95 2018 – 2039 5,023 5,017
Floating 2014 – 2018 5,500 1,000
Verizon Wireless–notes payable and other 8.50 – 8.88 2015 – 2018 3,931 8,635
Verizon Wireless–Alltel assumed notes 6.80 – 7.88 2016 – 2032 1,300 1,500
Telephone subsidiaries–debentures 5.13 – 6.86 2027 – 2033 1,075 2,045
7.38 – 7.88 2022 – 2032 1,099 1,349
8.00 – 8.75 2019 – 2031 880 880
Other subsidiaries–debentures and other 6.84 – 8.75 2018 – 2028 1,700 1,700
Capital lease obligations (average rate of 8.1% and 6.3% in 2013 and 2012, respectively) 293 298
Unamortized discount, net of premium (264) (228)
Total long-term debt, including current maturities 93,144 51,487
Less long-term debt maturing within one year 3,486 3,869
Total long-term debt $ 89,658 $ 47,618