Verizon Wireless 2013 Annual Report Download - page 16
Download and view the complete annual report
Please find page 16 of the 2013 Verizon Wireless annual report below. You can navigate through the pages in the report by either clicking on the pages listed below, or by using the keyword search tool below to find specific information within the annual report.-
 1
1 -
2
-
3
-
4
-
5
-
 6
6 -
 7
7 -
 8
8 -
 9
9 -
 10
10 -
 11
11 -
 12
12 -
 13
13 -
 14
14 -
 15
15 -
 16
16 -
 17
17 -
 18
18 -
 19
19 -
 20
20 -
 21
21 -
 22
22 -
 23
23 -
 24
24 -
 25
25 -
 26
26 -
27
-
28
-
29
-
30
-
31
-
32
-
33
-
34
-
35
-
36
-
37
-
38
-
39
-
40
-
41
-
42
-
43
-
44
-
45
-
46
-
47
-
48
-
49
-
50
-
51
-
52
-
53
-
54
-
55
-
56
-
57
-
58
-
59
-
60
-
61
-
62
-
63
-
64
-
65
-
66
-
67
-
68
-
69
-
70
-
71
-
72
-
73
-
74
-
75
-
76
 |
 |

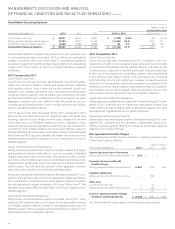
2012 Compared to 2011
Cost of Services and Sales
Cost of services and sales increased during 2012 compared to 2011 pri-
marily due to higher cost of equipment sales, increased cost of network
services and increased data roaming, partially oset by a decrease in cost
for data services, a decrease in network connection costs and a decrease
in the cost of long distance at our Wireless segment. Also contributing
to the increase were higher content costs associated with continued
FiOSsubscribergrowthandvendorrateincreases,increasedexpenses
relatedtoourcloudanddatacenteroering,highercostsrelatedtoFiOS
installation as well as higher repair and maintenance expenses caused by
storm-related events in 2012, partially oset by declines in access costs
and customer premise equipment costs at our Wireline segment.
Selling, General and Administrative Expense
Selling, general and administrative expense increased during 2012 com-
pared to 2011 primarily due to higher non-operational charges (see
“OtherItems”)aswellashighersalescommissionexpenseandcosts
associated with regulatory fees at our Wireless segment.
Depreciation and Amortization Expense
Depreciation and amortization expense decreased during 2012 com-
pared to 2011 primarily due to a decrease in depreciable assets at our
Wireline segment, partially oset by an increase in amortization expense
related to non-network software.
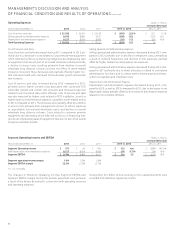
Non-operational (Credits) Charges
Non-operational (credits) charges included in operating expenses (see
"Other Items") were as follows:
(dollars in millions)
Years Ended December 31, 2013 2012 2011
Gain on Spectrum License Transaction
Selling, general and administrative expense $ (278) $ – $ –
Severance, Pension and Benet
(Credits) Charges
Selling, general and administrative expense (6,232) 7,186 5,954
Litigation Settlements
Selling, general and administrative expense – 384 –
Other Costs
Cost of services and sales – 40 –
Selling, general and administrative expense – 236 –
– 276 –
Total non-operating (credits) charges
included in operating expenses $ (6,510) $ 7,846 $ 5,954
See“OtherItems”foradescriptionofothernon-operationalitems.
14
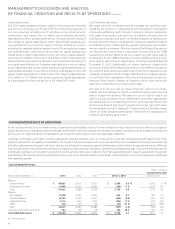
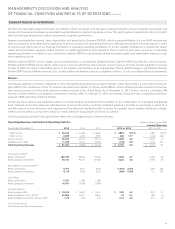
Consolidated Operating Expenses
(dollars in millions)
Increase/(Decrease)
Years Ended December 31, 2013 2012 2011 2013 vs. 2012 2012 vs. 2011
Cost of services and sales $ 44,887 $ 46,275 $ 45,875 $ (1,388) (3.0)% $ 400 0.9 %
Selling, general and administrative expense 27,089 39,951 35,624 (12,862) (32.2) 4,327 12.1
Depreciation and amortization expense 16,606 16,460 16,496 146 0.9 (36) (0.2)
Consolidated Operating Expenses $ 88,582 $ 102,686 $ 97,995 $ (14,104) (13.7) $ 4,691 4.8
Consolidated operating expenses decreased during 2013 primarily due
to non-operational credits recorded in 2013 as well as non-operational
chargesrecordedin2012(see“OtherItems”).Consolidatedoperating
expenses increased during 2012 primarily due to higher non-operational
charges(see“OtherItems”)as wellas increasedoperating expenses
at Wireless.
2013 Compared to 2012
Cost of Services and Sales
Cost of services and sales includes the following costs directly attrib-
utable to a service or product: salaries and wages, benets, materials
and supplies, content costs, contracted services, network access and
transport costs, wireless equipment costs, customer provisioning costs,
computer systems support, costs to support our outsourcing contracts
andtechnicalfacilitiesandcontributionstotheUniversalServiceFund.
Aggregate customer care costs, which include billing and service pro-
visioning, are allocated between Cost of services and sales and Selling,
general and administrative expense.
Cost of services and sales decreased during 2013 compared to 2012
primarily due to a decrease in cost of equipment sales, decreased data
roaming, a decline in cost of data services and a decrease in network
connection costs at our Wireless segment, as well as a decrease in costs
related to customer premise equipment, a decline in access costs and the
net eect of storm-related insurance recoveries at our Wireline segment.
Partially osetting these decreases were higher content costs associated
withcontinuedFiOSsubscribergrowthandvendorrateincreasesatour
Wireline segment, as well as increases in cost of network services at our
Wireless segment.
Selling, General and Administrative Expense
Selling, general and administrative expense includes: salaries and wages
and benets not directly attributable to a service or product; bad debt
charges; taxes other than income taxes; advertising and sales commis-
sion costs; customer billing; call center and information technology costs;
regulatory fees; professional service fees; and rent and utilities for admin-
istrative space. Also included are a portion of the aggregate customer
carecostsasdiscussedin“CostofServicesandSales”above.
Selling, general and administrative expense decreased during 2013 com-
pared to 2012 primarily due to the non-operational credits recorded in
2013 and declines in employee costs at our Wireline segment as well as
thenon-operationalchargesrecordedin2012(see“OtherItems”).This
decrease was partially oset by higher sales commission expense at our
Wireless segment.
Depreciation and Amortization Expense
Depreciation and amortization expense increased during 2013 com-
pared to 2012 primarily due to an increase in net depreciable assets at
our Wireless segment and an increase in amortization expense at our
Wireline segment. These increases were partially oset by a decline in net
depreciable assets at our Wireline segment.
MANAGEMENT’S DISCUSSION AND ANALYSIS
OF FINANCIAL CONDITION AND RESULTS OF OPERATIONS continued