Verizon Wireless 2013 Annual Report Download - page 22
Download and view the complete annual report
Please find page 22 of the 2013 Verizon Wireless annual report below. You can navigate through the pages in the report by either clicking on the pages listed below, or by using the keyword search tool below to find specific information within the annual report.-
 1
1 -
2
-
3
-
4
-
5
-
6
-
7
-
8
-
9
-
10
-
11
-
 12
12 -
 13
13 -
 14
14 -
 15
15 -
 16
16 -
 17
17 -
 18
18 -
 19
19 -
 20
20 -
 21
21 -
 22
22 -
 23
23 -
 24
24 -
 25
25 -
 26
26 -
 27
27 -
 28
28 -
 29
29 -
 30
30 -
 31
31 -
 32
32 -
33
-
34
-
35
-
36
-
37
-
38
-
39
-
40
-
41
-
42
-
43
-
44
-
45
-
46
-
47
-
48
-
49
-
50
-
51
-
52
-
53
-
54
-
55
-
56
-
57
-
58
-
59
-
60
-
61
-
62
-
63
-
64
-
65
-
66
-
67
-
68
-
69
-
70
-
71
-
72
-
73
-
74
-
75
-
76
 |
 |

20
Wireline’srevenuesdecreased$0.6billion,or1.4%,during2013com-
pared to 2012 primarily driven by declines in Global Enterprise Core and
Global Wholesale, partially oset by higher Consumer retail revenues
drivenbyFiOSservicesandincreasedStrategicservicesrevenueswithin
Global Enterprise.
Mass Markets
MassMarketsoperationsprovidebroadbandservices(includinghigh-
speedInternet,FiOSInternetandFiOSVideoservices),localexchange
(basic service and end-user access) and long distance (including regional
toll) voice services to residential and small business subscribers.
2013 Compared to 2012
MassMarketsrevenuesincreased$0.6billion,or3.7%,during2013com-
paredto2012primarilyduetotheexpansionofFiOSservices(Voice,
Internet and Video) as well as changes in our pricing strategies, partially
oset by the continued decline of local exchange revenues.
During2013,wegrewoursubscriberbaseby0.6millionFiOSInternet
subscribersandby0.5millionFiOSVideosubscribers,whilealsoconsis-
tentlyimprovingpenetrationrateswithinourFiOSserviceareas.Asof
December 31, 2013, we achieved penetration rates of 39.5% and 35.0%
forFiOSInternetandFiOSVideo,respectively,comparedtopenetration
ratesof37.3%and33.3%forFiOSInternetandFiOSVideo,respectively,at
December 31, 2012.
TheincreaseinMassMarketsrevenues,drivenbyFiOSservices,waspar-
tially oset by the decline of local exchange revenues primarily due to a
5.2% decline in Consumer retail voice connections resulting primarily from
competition and technology substitution with wireless, VoIP, broadband
and cable services. Total voice connections include traditional switched
accesslinesinserviceaswellasFiOSdigitalvoiceconnections.There
was also a decline in Small business retail voice connections, primarily
reecting competition and a shift to both IP and high-speed circuits.
2012 Compared to 2011
MassMarketsrevenuesincreasedduring2012comparedto2011pri-
marilyduetotheexpansionofFiOSservices(Voice,InternetandVideo)
as well as changes in our pricing strategy adopted in 2012, partially oset
by the continued decline of local exchange revenues.
We continued to grow our subscriber base and improved penetration
rateswithinour FiOSserviceareasduring2012.Also contributingto
theincreaseinrevenuefromFiOSserviceswerechangesinourpricing
strategy adopted in 2012. As of December 31, 2012, we achieved pen-
etration rates of 37.3% and 33.3% for FiOS Internet and FiOSVideo,
respectively,comparedtopenetrationratesof35.5%and31.5%forFiOS
InternetandFiOSVideo,respectively,atDecember31,2011.
MassMarketsrevenueswerenegativelyimpactedbythedeclineoflocal
exchange revenues primarily due to a 6.1% decline in Consumer retail
voice connections resulting primarily from competition and technology
substitution with wireless, VoIP, broadband and cable services. Total voice
connections include traditional switched access lines in service as well
asFiOSdigitalvoiceconnections.TherewasalsoadeclineinSmallbusi-
ness retail voice connections, primarily reecting challenging economic
conditions, competition and a shift to both IP and high-speed circuits.
MANAGEMENT’S DISCUSSION AND ANALYSIS
OF FINANCIAL CONDITION AND RESULTS OF OPERATIONS continued
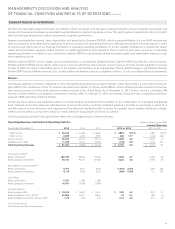
Wireline
Our Wireline segment provides voice, data and video communications products and enhanced services including broadband video and data, cor-
porate networking solutions, data center and cloud services, security and managed network services and local and long distance voice services. We
provide these products and services to consumers in the United States, as well as to carriers, businesses and government customers both in the
United States and in over 150 other countries around the world.
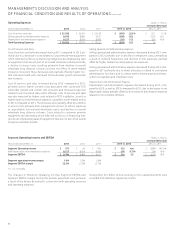
Operating Revenues and Selected Operating Statistics (dollars in millions)
Increase/(Decrease)
Years Ended December 31, 2013 2012 2011 2013 vs. 2012 2012 vs. 2011
Consumer retail $ 14,737 $ 14,043 $ 13,606 $ 694 4.9 % $ 437 3.2 %
Small business 2,591 2,659 2,731 (68) (2.6) (72) (2.6)
MassMarkets 17,328 16,702 16,337 626 3.7 365 2.2
Strategic services 8,420 8,052 7,575 368 4.6 477 6.3
Core 6,283 7,247 8,047 (964) (13.3) (800) (9.9)
Global Enterprise 14,703 15,299 15,622 (596) (3.9) (323) (2.1)
Global Wholesale 6,714 7,240 7,973 (526) (7.3) (733) (9.2)
Other 478 539 750 (61) (11.3) (211) (28.1)
Total Operating Revenues $ 39,223 $ 39,780 $ 40,682 $ (557) (1.4) $ (902) (2.2)
Connections ('000):(1)
Total voice connections 21,085 22,503 24,137 (1,418) (6.3) (1,634) (6.8)
TotalBroadbandconnections 9,015 8,795 8,670 220 2.5 125 1.4
FiOSInternetsubscribers 6,072 5,424 4,817 648 11.9 607 12.6
FiOSVideosubscribers 5,262 4,726 4,173 536 11.3 553 13.3
(1) As of end of period