Verizon Wireless 2013 Annual Report Download - page 57
Download and view the complete annual report
Please find page 57 of the 2013 Verizon Wireless annual report below. You can navigate through the pages in the report by either clicking on the pages listed below, or by using the keyword search tool below to find specific information within the annual report.-
 1
1 -
2
-
3
-
4
-
5
-
6
-
7
-
8
-
9
-
10
-
11
-
12
-
13
-
14
-
15
-
16
-
17
-
18
-
19
-
20
-
21
-
22
-
23
-
24
-
25
-
26
-
27
-
28
-
29
-
30
-
31
-
32
-
33
-
34
-
35
-
36
-
37
-
38
-
39
-
40
-
41
-
42
-
43
-
44
-
45
-
46
-
 47
47 -
 48
48 -
 49
49 -
 50
50 -
 51
51 -
 52
52 -
 53
53 -
 54
54 -
 55
55 -
 56
56 -
 57
57 -
 58
58 -
 59
59 -
 60
60 -
 61
61 -
 62
62 -
 63
63 -
 64
64 -
 65
65 -
 66
66 -
 67
67 -
68
-
69
-
70
-
71
-
72
-
73
-
74
-
75
-
76
 |
 |

NOTES TO CONSOLIDATED FINANCIAL STATEMENTS continued
55
NOTE 9
FAIR VALUE MEASUREMENTS AND FINANCIAL INSTRUMENTS
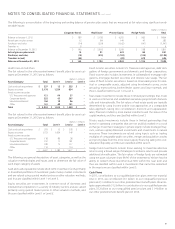
The following table presents the balances of assets and liabilities mea-
sured at fair value on a recurring basis as of December 31, 2013:
(dollars in millions)
Level 1(1) Level 2(2) Level 3(3) Total
Assets:
Cash and cash equivalents:
Fixed income securities $ 9,190 $ – $ – $ 9,190
Short-term investments:
Equity securities 387 – – 387
Fixed income securities 3 211 – 214
Other assets:
Forward interest rate swaps – 76 – 76
Fixed income securities – 875 – 875
Cross currency swaps – 166 – 166
Total $ 9,580 $ 1,328 $ – $ 10,908
Liabilities:
Other liabilities:
Interest rate swaps $ – $ 23 $ – $ 23
Total $ – $ 23 $ – $ 23
(1) quoted prices in active markets for identical assets or liabilities
(2)
observable inputs other than quoted prices in active markets for identical assets and liabilities
(3) no observable pricing inputs in the market
Equity securities consist of investments in common stock of domestic and
international corporations measured using quoted prices in active markets.
Fixed income securities consist primarily of investments in U.S. Treasuries,
as well as municipal bonds. We use quoted prices in active markets for
our U.S. Treasury securities, and therefore these securities are classied
as Level 1. For all other xed income securities that do not have quoted
prices in active markets, we use alternative matrix pricing resulting in
these debt securities being classied as Level 2.
Derivative contracts are valued using models based on readily observable
market parameters for all substantial terms of our derivative contracts
and thus are classied within Level 2. We use mid-market pricing for fair
value measurements of our derivative instruments. Our derivative instru-
ments are recorded on a gross basis.
We recognize transfers between levels of the fair value hierarchy as of the
end of the reporting period. There were no transfers within the fair value
hierarchy during 2013.
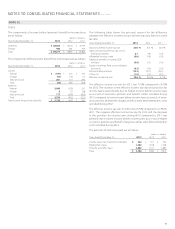
Fair Value of Short-term and Long-term Debt
The fair value of our debt is determined using various methods, including
quoted prices for identical terms and maturities, which is a Level 1 mea-
surement, as well as quoted prices for similar terms and maturities in
inactive markets and future cash ows discounted at current rates, which
are Level 2 measurements. The fair value of our short-term and long-term
debt, excluding capital leases, was as follows:
(dollars in millions)
At December 31, 2013 2012
Carrying
Amount
Fair
Value
Carrying
Amount
Fair
Value
Short- and long-term debt,
excluding capital leases $ 93,298 $ 103,527 $ 51,689 $ 61,552
Derivative Instruments
Interest Rate Swaps
We have entered into domestic interest rate swaps to achieve a targeted
mix of xed and variable rate debt. We principally receive xed rates and
pay variable rates based on LIBOR, resulting in a net increase or decrease
to Interest expense. These swaps are designated as fair value hedges and
hedge against changes in the fair value of our debt portfolio. We record
the interest rate swaps at fair value on our consolidated balance sheets
as assets and liabilities.
During 2012, interest rate swaps with a notional value of $5.8 billion were
settled. As a result of the settlements, we received net proceeds of $0.7
billion, including accrued interest which is included in Other, net oper-
ating activities in the consolidated statement of cash ows. The fair value
basis adjustment to the underlying debt instruments was recognized
into earnings as a reduction of Interest expense over the remaining lives
of the underlying debt obligations. During the second quarter of 2013,
interest rate swaps with a notional value of $1.25 billion matured and
the impact to our consolidated nancial statements was not material.
During the third quarter of 2013, we entered into interest rate swaps with
a total notional value of $1.8 billion. At December 31, 2013 and 2012, the
fair value of these interest rate swaps was not material. At December 31,
2013, the total notional amount of these interest rate swaps was $1.8 bil-
lion. The ineective portion of these interest rate swaps was not material
at December 31, 2013.
Forward Interest Rate Swaps
In order to manage our exposure to future interest rate changes, during
the fourth quarter of 2013, we entered into forward interest rate swaps
with a notional value of $2.0 billion. We designated these contracts as
cash ow hedges. The fair value of these contracts was not material at
December 31, 2013.
Cross Currency Swaps
Verizon Wireless previously entered into cross currency swaps designated
as cash ow hedges to exchange approximately $1.6 billion of British
Pound Sterling and Euro-denominated debt into U.S. dollars and to x
our future interest and principal payments in U.S. dollars, as well as to
mitigate the impact of foreign currency transaction gains or losses. A por-
tion of the gains and losses recognized in Other comprehensive income
was reclassied to Other income and (expense), net to oset the related
pre-tax foreign currency transaction gain or loss on the underlying debt
obligations. The fair value of the outstanding swaps was not material at
December 31, 2013 or December 31, 2012. During 2013 and 2012 the
gains with respect to these swaps were not material.
During February 2014, we entered into cross currency swaps designated
as cash ow hedges to exchange approximately $5.4 billion of Euro and
British Pound Sterling denominated debt into U.S. dollars and to x our
future interest and principal payments in U.S. dollars, as well as to miti-
gate the impact of foreign currency transaction gains or losses.
Concentrations of Credit Risk
Financial instruments that subject us to concentrations of credit risk con-
sist primarily of temporary cash investments, short-term and long-term
investments, trade receivables, certain notes receivable, including lease
receivables, and derivative contracts. Our policy is to deposit our tempo-
rary cash investments with major nancial institutions. Counterparties to
our derivative contracts are also major nancial institutions with whom
we have negotiated derivatives agreements (ISDA master agreement)
and credit support annex agreements which provide rules for collat-
eral exchange. We generally apply collateralized arrangements with our
counterparties for uncleared derivatives to mitigate credit risk. We may
enter into swaps on an uncollateralized basis in certain circumstances.
While we may be exposed to credit losses due to the nonperformance
of our counterparties, we consider the risk remote and do not expect the
settlement of these transactions to have a material eect on our results
of operations or nancial condition.