Verizon Wireless 2013 Annual Report Download - page 65
Download and view the complete annual report
Please find page 65 of the 2013 Verizon Wireless annual report below. You can navigate through the pages in the report by either clicking on the pages listed below, or by using the keyword search tool below to find specific information within the annual report.-
 1
1 -
2
-
3
-
4
-
5
-
6
-
7
-
8
-
9
-
10
-
11
-
12
-
13
-
14
-
15
-
16
-
17
-
18
-
19
-
20
-
21
-
22
-
23
-
24
-
25
-
26
-
27
-
28
-
29
-
30
-
31
-
32
-
33
-
34
-
35
-
36
-
37
-
38
-
39
-
40
-
41
-
42
-
43
-
44
-
45
-
46
-
47
-
48
-
49
-
50
-
51
-
52
-
53
-
54
-
 55
55 -
 56
56 -
 57
57 -
 58
58 -
 59
59 -
 60
60 -
 61
61 -
 62
62 -
 63
63 -
 64
64 -
 65
65 -
 66
66 -
 67
67 -
 68
68 -
 69
69 -
 70
70 -
 71
71 -
 72
72 -
 73
73 -
 74
74 -
 75
75 -
76
 |
 |

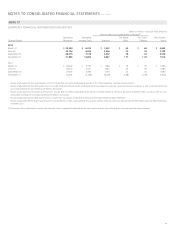
NOTES TO CONSOLIDATED FINANCIAL STATEMENTS continued
63
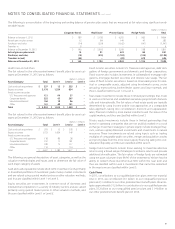
NOTE 12
TAXES
The components of income before (provision) benet for income taxes
are as follows:
(dollars in millions)
Years Ended December 31, 2013 2012 2011
Domestic $ 28,833 $ 9,316 $ 9,724
Foreign 444 581 759
Total $ 29,277 $ 9,897 $ 10,483
The components of the provision (benet) for income taxes are as follows:
(dollars in millions)
Years Ended December 31, 2013 2012 2011
Current
Federal $ (197) $ 223 $ 193
Foreign (59) (45) 25
State and Local 201 114 290
Total (55) 292 508
Deferred
Federal 5,060 (559) 270
Foreign 8 10 (38)
State and Local 717 (403) (455)
Total 5,785 (952) (223)
Total income tax provision (benet) $ 5,730 $ (660) $ 285
The following table shows the principal reasons for the difference
between the eective income tax rate and the statutory federal income
tax rate:
Years Ended December 31, 2013 2012 2011
Statutory federal income tax rate 35.0 % 35.0 % 35.0 %
State and local income tax rate, net of
federal tax benets 2.1 (1.9) (1.0)
Aordable housing credit (0.6) (1.9) (1.8)
Employee benets including ESOP
dividend (0.4) (1.1) (1.4)
Equity in earnings from unconsolidated
businesses (0.3) (1.4) (1.9)
Noncontrolling interests (14.3) (33.7) (23.0)
Other, net (1.9) (1.7) (3.2)
Eective income tax rate 19.6 % (6.7)% 2.7 %
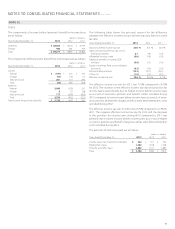
The eective income tax rate for 2013 was 19.6% compared to (6.7)%
for 2012. The increase in the eective income tax rate and provision for
income taxes was primarily due to higher income before income taxes
as a result of severance, pension and benet credits recorded during
2013 compared to lower income before income taxes as a result of sever-
ance, pension and benet charges as well as early debt redemption costs
recorded during 2012.
The eective income tax rate for 2012 was (6.7)% compared to 2.7% for
2011. The negative eective income tax rate for 2012 and the decrease
in the provision for income taxes during 2012 compared to 2011 was
primarily due to lower income before income taxes as a result of higher
severance, pension and benet charges as well as early debt redemption
costs recorded during 2012.
The amounts of cash taxes paid are as follows:
(dollars in millions)
Years Ended December 31, 2013 2012 2011
Income taxes, net of amounts refunded $ 422 $ 351 $ 762
Employment taxes 1,282 1,308 1,328
Property and other taxes 2,082 1,727 1,883
Total $ 3,786 $ 3,386 $ 3,973