Verizon Wireless 2013 Annual Report Download - page 67
Download and view the complete annual report
Please find page 67 of the 2013 Verizon Wireless annual report below. You can navigate through the pages in the report by either clicking on the pages listed below, or by using the keyword search tool below to find specific information within the annual report.-
 1
1 -
2
-
3
-
4
-
5
-
6
-
7
-
8
-
9
-
10
-
11
-
12
-
13
-
14
-
15
-
16
-
17
-
18
-
19
-
20
-
21
-
22
-
23
-
24
-
25
-
26
-
27
-
28
-
29
-
30
-
31
-
32
-
33
-
34
-
35
-
36
-
37
-
38
-
39
-
40
-
41
-
42
-
43
-
44
-
45
-
46
-
47
-
48
-
49
-
50
-
51
-
52
-
53
-
54
-
55
-
56
-
 57
57 -
 58
58 -
 59
59 -
 60
60 -
 61
61 -
 62
62 -
 63
63 -
 64
64 -
 65
65 -
 66
66 -
 67
67 -
 68
68 -
 69
69 -
 70
70 -
 71
71 -
 72
72 -
 73
73 -
 74
74 -
 75
75 -
 76
76
 |
 |

NOTES TO CONSOLIDATED FINANCIAL STATEMENTS continued
65
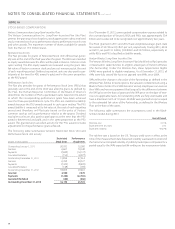
NOTE 13
SEGMENT INFORMATION
Reportable Segments
We have two reportable segments, which we operate and manage as
strategic business units and organize by products and services. We mea-
sure and evaluate our reportable segments based on segment operating
income, consistent with the chief operating decision maker’s assessment
of segment performance.
Corporate, eliminations and other includes unallocated corporate
expenses, intersegment eliminations recorded in consolidation, the
results of other businesses, such as our investments in unconsolidated
businesses, pension and other employee benefit related costs, lease
nancing, as well as other adjustments and gains and losses that are not
allocated in assessing segment performance due to their non-operational
nature. Although such transactions are excluded from the business seg-
ment results, they are included in reported consolidated earnings. Gains
and losses that are not individually signicant are included in all segment
results as these items are included in the chief operating decision maker’s
assessment of segment performance.
The reconciliation of segment operating revenues and expenses to con-
solidated operating revenues and expenses below also includes those
items of a non-recurring or non-operational nature. We exclude from
segment results the eects of certain items that management does not
consider in assessing segment performance, primarily because of their
non-recurring or non-operational nature.
We have adjusted prior period consolidated and segment information,
where applicable, to conform to current year presentation.
Our segments and their principal activities consist of the following:
Segment Description
Wireless Wireless’ communications products and services include wire-
less voice and data services and equipment sales, which are
provided to consumer, business and government customers
across the United States.
Wireline Wireline’s voice, data and video communications products and
enhanced services include broadband video and data, cor-
porate networking solutions, data center and cloud services,
security and managed network services and local and long
distance voice services. We provide these products and ser-
vices to consumers in the United States, as well as to carriers,
businesses and government customers both in the United
States and in over 150 other countries around the world.
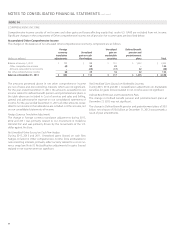
The following table provides operating nancial information for our two reportable segments:
(dollars in millions)
2013 Wireless Wireline Total Segments
External Operating Revenues
Retail service $ 66,282 $ – $ 66,282
Other service 2,691 – 2,691
Service revenue 68,973 – 68,973
Equipment 8,096 – 8,096
Other 3,851 – 3,851
Consumer retail – 14,737 14,737
Small business – 2,587 2,587
Mass Markets – 17,324 17,324
Strategic services – 8,410 8,410
Core – 6,267 6,267
Global Enterprise – 14,677 14,677
Global Wholesale – 5,703 5,703
Other – 456 456
Intersegment revenues 103 1,063 1,166
Total operating revenues 81,023 39,223 120,246
Cost of services and sales 23,648 21,928 45,576
Selling, general and administrative expense 23,176 8,595 31,771
Depreciation and amortization expense 8,202 8,327 16,529
Total operating expenses 55,026 38,850 93,876
Operating income $ 25,997 $ 373 $ 26,370
Assets $ 146,429 $ 84,573 $ 231,002
Plant, property and equipment, net 35,932 51,885 87,817
Capital expenditures 9,425 6,229 15,654