Verizon Wireless 2013 Annual Report Download - page 53
Download and view the complete annual report
Please find page 53 of the 2013 Verizon Wireless annual report below. You can navigate through the pages in the report by either clicking on the pages listed below, or by using the keyword search tool below to find specific information within the annual report.-
 1
1 -
2
-
3
-
4
-
5
-
6
-
7
-
8
-
9
-
10
-
11
-
12
-
13
-
14
-
15
-
16
-
17
-
18
-
19
-
20
-
21
-
22
-
23
-
24
-
25
-
26
-
27
-
28
-
29
-
30
-
31
-
32
-
33
-
34
-
35
-
36
-
37
-
38
-
39
-
40
-
41
-
42
-
 43
43 -
 44
44 -
 45
45 -
 46
46 -
 47
47 -
 48
48 -
 49
49 -
 50
50 -
 51
51 -
 52
52 -
 53
53 -
 54
54 -
 55
55 -
 56
56 -
 57
57 -
 58
58 -
 59
59 -
 60
60 -
 61
61 -
 62
62 -
 63
63 -
64
-
65
-
66
-
67
-
68
-
69
-
70
-
71
-
72
-
73
-
74
-
75
-
76
 |
 |

51
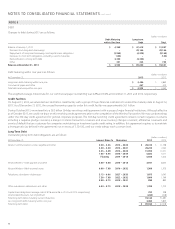
Accumulated deferred taxes arising from leveraged leases, which are
included in Deferred income taxes, amounted to $1.0 billion at December
31, 2013 and $1.2 billion at December 31, 2012.
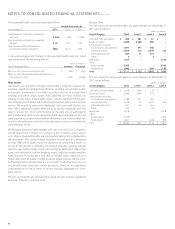
The following table is a summary of the components of income from
leveraged leases:
(dollars in millions)
Years Ended December 31, 2013 2012 2011
Pre-tax income $ 34 $ 30 $ 61
Income tax expense 12 12 24
The future minimum lease payments to be received from noncancelable
capital leases (direct nancing and leveraged leases), net of nonrecourse
loan payments related to leveraged leases and allowances for doubtful
accounts, along with expected receipts relating to operating leases for
the periods shown at December 31, 2013, are as follows:
(dollars in millions)
Years
Capital
Leases
Operating
Leases
2014 $ 34 $ 197
2015 46 170
2016 114 142
2017 38 50
2018 56 23
Thereafter 797 19
Total $ 1,085 $ 601
As Lessee
We lease certain facilities and equipment for use in our operations under
both capital and operating leases. Total rent expense under operating
leases amounted to $2.6 billion in 2013 and $2.5 billion in 2012 and 2011,
respectively.
Amortization of capital leases is included in Depreciation and amortiza-
tion expense in the consolidated statements of income. Capital lease
amounts included in Plant, property and equipment are as follows:
(dollars in millions)
At December 31, 2013 2012
Capital leases $ 353 $ 358
Less accumulated amortization 188 158
Total $ 165 $ 200
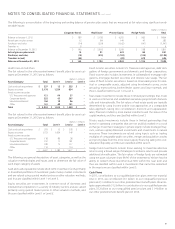
The aggregate minimum rental commitments under noncancelable
leases for the periods shown at December 31, 2013, are as follows:
(dollars in millions)
Years
Capital
Leases
Operating
Leases
2014 $ 110 $ 2,255
2015 70 2,020
2016 54 1,703
2017 46 1,379
2018 20 1,085
Thereafter 83 3,748
Total minimum rental commitments 383 $ 12,190
Less interest and executory costs 90
Present value of minimum lease payments 293
Less current installments 91
Long-term obligation at December 31, 2013 $ 202
NOTES TO CONSOLIDATED FINANCIAL STATEMENTS continued
NOTE 7
LEASING ARRANGEMENTS
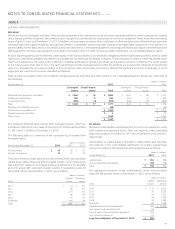
As Lessor
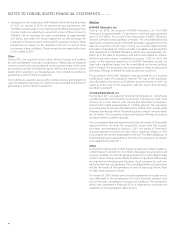
We are the lessor in leveraged and direct nancing lease agreements for commercial aircraft and power generating facilities, which comprise the majority
of our leasing portfolio along with telecommunications equipment, commercial real estate property and other equipment. These leases have remaining
terms of up to 37 years as of December 31, 2013. In addition, we lease space on certain of our cell towers to other wireless carriers. Minimum lease payments
receivable represent unpaid rentals, less principal and interest on third-party nonrecourse debt relating to leveraged lease transactions. Since we have no
general liability for this debt, which is secured by a senior security interest in the leased equipment and rentals, the related principal and interest have been
oset against the minimum lease payments receivable in accordance with U.S. GAAP. All recourse debt is reected in our consolidated balance sheets.
At each reporting period, we monitor the credit quality of the various lessees in our portfolios. Regarding the leveraged lease portfolio, external credit
reports are used where available and where not available we use internally developed indicators. These indicators or internal credit risk grades factor
historic loss experience, the value of the underlying collateral, delinquency trends, and industry and general economic conditions. The credit quality
of our lessees varies from AAA to CCC+. For each reporting period the leveraged leases within the portfolio are reviewed for indicators of impairment
where it is probable the rent due according to the contractual terms of the lease will not be collected. All signicant accounts, individually or in the
aggregate, are current and none are classied as impaired.
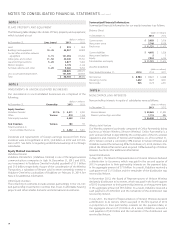
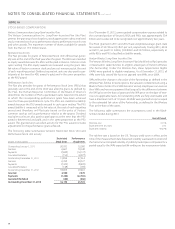
Finance lease receivables, which are included in Prepaid expenses and other and Other assets in our consolidated balance sheets, are comprised of
the following:
(dollars in millions)
At December 31, 2013 2012
Leveraged
Leases
Direct Finance
Leases Total
Leveraged
Leases
Direct Finance
Leases Total
Minimum lease payments receivable $ 1,069 $ 16 $ 1,085 $ 1,253 $ 58 $ 1,311
Estimated residual value 780 5 785 923 6 929
Unearned income (589) (4) (593) (654) (10) (664)
Total $ 1,260 $ 17 $ 1,277 $ 1,522 $ 54 $ 1,576
Allowance for doubtful accounts (90) (99)
Finance lease receivables, net $ 1,187 $ 1,477
Prepaid expenses and other $ 5 $ 22
Other assets 1,182 1,455
$ 1,187 $ 1,477