Verizon Wireless 2013 Annual Report Download - page 2
Download and view the complete annual report
Please find page 2 of the 2013 Verizon Wireless annual report below. You can navigate through the pages in the report by either clicking on the pages listed below, or by using the keyword search tool below to find specific information within the annual report.-
 1
1 -
 2
2 -
 3
3 -
 4
4 -
 5
5 -
 6
6 -
 7
7 -
 8
8 -
 9
9 -
 10
10 -
 11
11 -
 12
12 -
 13
13 -
14
-
15
-
16
-
17
-
18
-
19
-
20
-
21
-
22
-
23
-
24
-
25
-
26
-
27
-
28
-
29
-
30
-
31
-
32
-
33
-
34
-
35
-
36
-
37
-
38
-
39
-
40
-
41
-
42
-
43
-
44
-
45
-
46
-
47
-
48
-
49
-
50
-
51
-
52
-
53
-
54
-
55
-
56
-
57
-
58
-
59
-
60
-
61
-
62
-
63
-
64
-
65
-
66
-
67
-
68
-
69
-
70
-
71
-
72
-
73
-
74
-
75
-
76
 |
 |
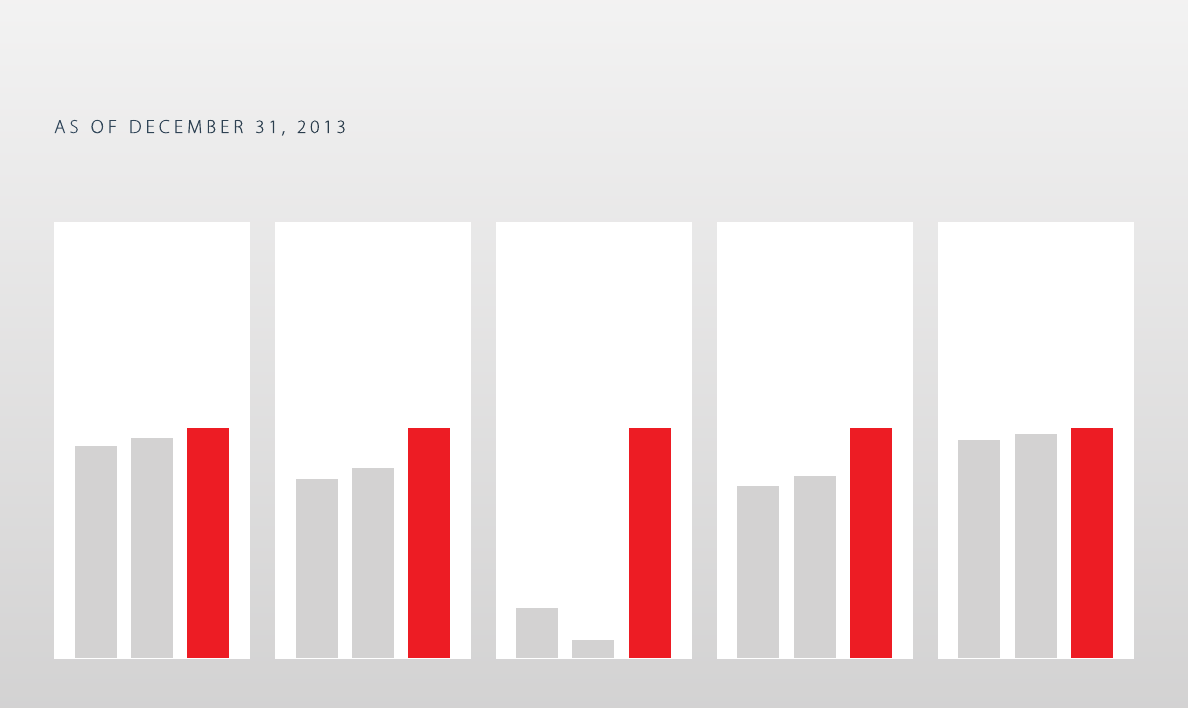
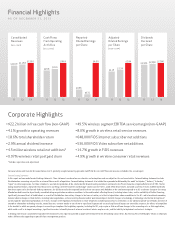
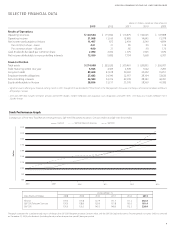
Financial Highlights
AS OF DECEMBER 31, 2013
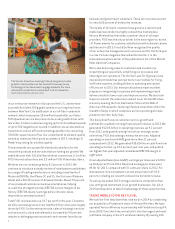
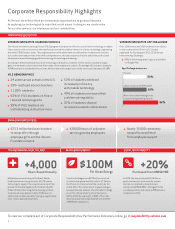
Corporate Highlights
* Excludes acquisitions and adjustments
See www.verizon.com/investor for reconciliations to U.S. generally accepted accounting principles (GAAP) for the non-GAAP financial measures included in this annual report.
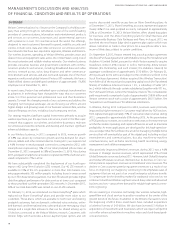
Forward-Looking Statements
In this report we have made forward-looking statements. These statements are based on our estimates and assumptions and are subject to risks and uncertainties. Forward-looking statements include
the information concerning our possible or assumed future results of operations. Forward-looking statements also include those preceded or followed by the words “anticipates,” “believes,” “estimates,”
“hopes” or similar expressions. For those statements, we claim the protection of the safe harbor for forward-looking statements contained in the Private Securities Litigation Reform Act of 1995. The fol-
lowing important factors, along with those discussed in our filings with the Securities and Exchange Commission (the “SEC”), could affect future results and could cause those results to differ materially
from those expressed in the forward-looking statements: the ability to realize the expected benefits of our transaction with Vodafone in the timeframe expected or at all; an adverse change in the ratings
afforded our debt securities by nationally accredited ratings organizations or adverse conditions in the credit markets affecting the cost, including interest rates, and/or availability of further financing;
significantly increased levels of indebtedness as a result of the Vodafone transaction; changes in tax laws or treaties, or in their interpretation; adverse conditions in the U.S. and international economies;
material adverse changes in labor matters, including labor negotiations, and any resulting financial and/or operational impact; material changes in technology or technology substitution; disruption of
our key suppliers’ provisioning of products or services; changes in the regulatory environment in which we operate, including any increase in restrictions on our ability to operate our networks; breaches of
network or information technology security, natural disasters, terrorist attacks or acts of war or significant litigation and any resulting financial impact not covered by insurance; the effects of competition
in the markets in which we operate; changes in accounting assumptions that regulatory agencies, including the SEC, may require or that result from changes in the accounting rules or their application,
which could result in an impact on earnings; significant increases in benefit plan costs or lower investment returns on plan assets; and the inability to implement our business strategies.
In keeping with Verizon’s commitment to protect the environment, this report was printed on paper certified by the Forest Stewardship Council (FSC). By selecting FSC-certified paper, Verizon is helping to
make a difference by supporting responsible forest management practices.
•$22.2billioninfreecashow(non-GAAP)
•4.1%growthinoperatingrevenues
•18.6%totalshareholderreturn
•2.9%annualdividendincrease
•4.5millionwirelessretailnetadditions*
•0.97%wirelessretailpostpaidchurn
•49.5%wirelesssegmentEBITDAservicemargin(non-GAAP)
•8.0%growthinwirelessretailservicerevenues
•648,000FiOSInternetsubscribernetadditions
•536,000FiOSVideosubscribernetadditions
•14.7%growthinFiOSrevenues
•4.9%growthinwirelineconsumerretailrevenues
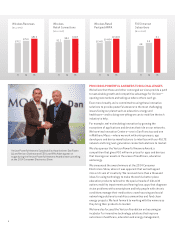
$110.9 $115.8 $120.6
Consolidated
Revenues
()
$29.8 $31.5
$38.8
Cash Flows
from Operating
Activities
()
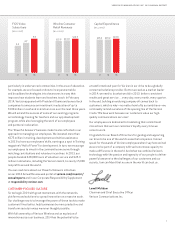
$0.85
$0.31
$4.00
Reported
Diluted Earnings
per Share
$2.15 $2.24
$2.84
Adjusted
Diluted Earnings
per Share
(-)
$1.975 $2.030 $2.090
Dividends
Declared
per Share