Verizon Wireless 2013 Annual Report Download - page 43
Download and view the complete annual report
Please find page 43 of the 2013 Verizon Wireless annual report below. You can navigate through the pages in the report by either clicking on the pages listed below, or by using the keyword search tool below to find specific information within the annual report.-
 1
1 -
2
-
3
-
4
-
5
-
6
-
7
-
8
-
9
-
10
-
11
-
12
-
13
-
14
-
15
-
16
-
17
-
18
-
19
-
20
-
21
-
22
-
23
-
24
-
25
-
26
-
27
-
28
-
29
-
30
-
31
-
32
-
 33
33 -
 34
34 -
 35
35 -
 36
36 -
 37
37 -
 38
38 -
 39
39 -
 40
40 -
 41
41 -
 42
42 -
 43
43 -
 44
44 -
 45
45 -
 46
46 -
 47
47 -
 48
48 -
 49
49 -
 50
50 -
 51
51 -
 52
52 -
 53
53 -
54
-
55
-
56
-
57
-
58
-
59
-
60
-
61
-
62
-
63
-
64
-
65
-
66
-
67
-
68
-
69
-
70
-
71
-
72
-
73
-
74
-
75
-
76
 |
 |

41
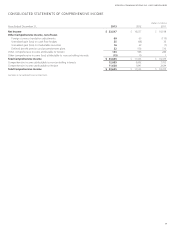
VERIZON COMMUNICATIONS INC. AND SUBSIDIARIES
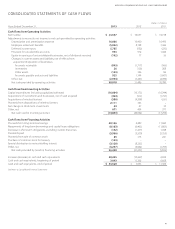
CONSOLIDATED STATEMENTS OF CASH FLOWS
(dollars in millions)
Years Ended December 31, 2013 2012 2011
Cash Flows from Operating Activities
Net Income $ 23,547 $ 10,557 $ 10,198
Adjustments to reconcile net income to net cash provided by operating activities:
Depreciation and amortization expense 16,606 16,460 16,496
Employee retirement benets (5,052) 8,198 7,426
Deferred income taxes 5,785 (952) (223)
Provision for uncollectible accounts 993 972 1,026
Equity in earnings of unconsolidated businesses, net of dividends received (102) 77 36
Changes in current assets and liabilities, net of eects from
acquisition/disposition of businesses
Accounts receivable (843) (1,717) (966)
Inventories 56 (136) 208
Other assets (143) 306 86
Accounts payable and accrued liabilities 925 1,144 (1,607)
Other, net (2,954) (3,423) (2,900)
Net cash provided by operating activities 38,818 31,486 29,780
Cash Flows from Investing Activities
Capital expenditures (including capitalized software) (16,604) (16,175) (16,244)
Acquisitions of investments and businesses, net of cash acquired (494) (913) (1,797)
Acquisitions of wireless licenses (580) (4,298) (221)
Proceeds from dispositions of wireless licenses 2,111 363 –
Net change in short-term investments 63 27 35
Other, net 671 494 977
Net cash used in investing activities (14,833) (20,502) (17,250)
Cash Flows from Financing Activities
Proceeds from long-term borrowings 49,166 4,489 11,060
Repayments of long-term borrowings and capital lease obligations (8,163) (6,403) (11,805)
Decrease in short-term obligations, excluding current maturities (142) (1,437) 1,928
Dividends paid (5,936) (5,230) (5,555)
Proceeds from sale of common stock 85 315 241
Purchase of common stock for treasury (153) – –
Special distribution to noncontrolling interest (3,150) (8,325) –
Other, net (5,257) (4,662) (1,705)
Net cash provided by (used in) nancing activities 26,450 (21,253) (5,836)
Increase (decrease) in cash and cash equivalents 50,435 (10,269) 6,694
Cash and cash equivalents, beginning of period 3,093 13,362 6,668
Cash and cash equivalents, end of period $ 53,528 $ 3,093 $ 13,362
See Notes to Consolidated Financial Statements