Verizon Wireless 2013 Annual Report Download - page 68
Download and view the complete annual report
Please find page 68 of the 2013 Verizon Wireless annual report below. You can navigate through the pages in the report by either clicking on the pages listed below, or by using the keyword search tool below to find specific information within the annual report.-
 1
1 -
2
-
3
-
4
-
5
-
6
-
7
-
8
-
9
-
10
-
11
-
12
-
13
-
14
-
15
-
16
-
17
-
18
-
19
-
20
-
21
-
22
-
23
-
24
-
25
-
26
-
27
-
28
-
29
-
30
-
31
-
32
-
33
-
34
-
35
-
36
-
37
-
38
-
39
-
40
-
41
-
42
-
43
-
44
-
45
-
46
-
47
-
48
-
49
-
50
-
51
-
52
-
53
-
54
-
55
-
56
-
57
-
 58
58 -
 59
59 -
 60
60 -
 61
61 -
 62
62 -
 63
63 -
 64
64 -
 65
65 -
 66
66 -
 67
67 -
 68
68 -
 69
69 -
 70
70 -
 71
71 -
 72
72 -
 73
73 -
 74
74 -
 75
75 -
 76
76
 |
 |

66
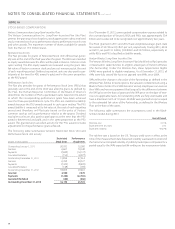
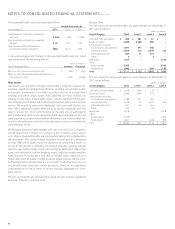
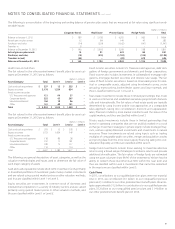
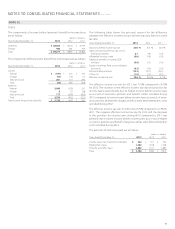
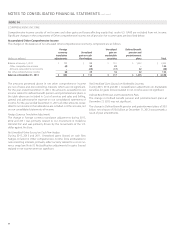
NOTES TO CONSOLIDATED FINANCIAL STATEMENTS continued
(dollars in millions)
2012 Wireless Wireline Total Segments
External Operating Revenues
Retail service $ 61,383 $ – $ 61,383
Other service 2,290 – 2,290
Service revenue 63,673 – 63,673
Equipment 8,010 – 8,010
Other 4,096 – 4,096
Consumer retail – 14,043 14,043
Small business – 2,648 2,648
Mass Markets – 16,691 16,691
Strategic services – 8,052 8,052
Core – 7,240 7,240
Global Enterprise – 15,292 15,292
Global Wholesale – 6,177 6,177
Other – 508 508
Intersegment revenues 89 1,112 1,201
Total operating revenues 75,868 39,780 115,648
Cost of services and sales 24,490 22,413 46,903
Selling, general and administrative expense 21,650 8,883 30,533
Depreciation and amortization expense 7,960 8,424 16,384
Total operating expenses 54,100 39,720 93,820
Operating income $ 21,768 $ 60 $ 21,828
Assets $ 142,485 $ 84,815 $ 227,300
Plant, property and equipment, net 34,545 52,911 87,456
Capital expenditures 8,857 6,342 15,199
(dollars in millions)
2011 Wireless Wireline Total Segments
External Operating Revenues
Retail service $ 56,601 $ – $ 56,601
Other service 2,497 – 2,497
Service revenue 59,098 – 59,098
Equipment 7,446 – 7,446
Other 3,517 – 3,517
Consumer retail – 13,605 13,605
Small business – 2,720 2,720
Mass Markets – 16,325 16,325
Strategic services – 7,607 7,607
Core – 8,014 8,014
Global Enterprise – 15,621 15,621
Global Wholesale – 6,795 6,795
Other – 704 704
Intersegment revenues 93 1,237 1,330
Total operating revenues 70,154 40,682 110,836
Cost of services and sales 24,086 22,158 46,244
Selling, general and administrative expense 19,579 9,107 28,686
Depreciation and amortization expense 7,962 8,458 16,420
Total operating expenses 51,627 39,723 91,350
Operating income $ 18,527 $ 959 $ 19,486
Assets $ 147,378 $ 86,185 $ 233,563
Plant, property and equipment, net 33,451 54,149 87,600
Capital expenditures 8,973 6,399 15,372