Verizon Wireless 2013 Annual Report Download - page 26
Download and view the complete annual report
Please find page 26 of the 2013 Verizon Wireless annual report below. You can navigate through the pages in the report by either clicking on the pages listed below, or by using the keyword search tool below to find specific information within the annual report.-
 1
1 -
2
-
3
-
4
-
5
-
6
-
7
-
8
-
9
-
10
-
11
-
12
-
13
-
14
-
15
-
 16
16 -
 17
17 -
 18
18 -
 19
19 -
 20
20 -
 21
21 -
 22
22 -
 23
23 -
 24
24 -
 25
25 -
 26
26 -
 27
27 -
 28
28 -
 29
29 -
 30
30 -
 31
31 -
 32
32 -
 33
33 -
 34
34 -
 35
35 -
 36
36 -
37
-
38
-
39
-
40
-
41
-
42
-
43
-
44
-
45
-
46
-
47
-
48
-
49
-
50
-
51
-
52
-
53
-
54
-
55
-
56
-
57
-
58
-
59
-
60
-
61
-
62
-
63
-
64
-
65
-
66
-
67
-
68
-
69
-
70
-
71
-
72
-
73
-
74
-
75
-
76
 |
 |

24
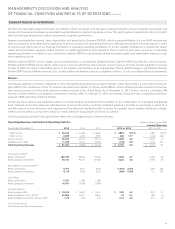
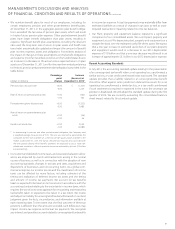
Cash Flows Used In Investing Activities
Capital Expenditures
Capital expenditures continue to be our primary use of capital resources
as they facilitate the introduction of new products and services, enhance
responsiveness to competitive challenges and increase the operating
eciency and productivity of our networks.
Capital expenditures, including capitalized software, were as follows:
(dollars in millions)
Years Ended December 31, 2013 2012 2011
Wireless $ 9,425 $ 8,857 $ 8,973
Wireline 6,229 6,342 6,399
Other 950 976 872
$ 16,604 $ 16,175 $ 16,244
Total as a percentage of revenue 13.8% 14.0% 14.7%
Capital expenditures increased at Wireless in 2013 compared to 2012
in order to substantially complete the build-out of our 4G LTE network.
Capital expenditures declined at Wireline as a result of decreased legacy
spendingrequirementsandadeclineinspendingonourFiOSnetwork.
Capital expenditures declined slightly at Wireless in 2012 compared to
2011 due to the decreased investment in the capacity of our wireless
EV-DO network, partially oset by the increased build-out of our 4G LTE
network. Capital expenditures declined slightly at Wireline due to lower
legacy spending requirements.
Acquisitions
During 2013, 2012 and 2011, we invested $0.6 billion, $4.3 billion and
$0.2 billion, respectively, in acquisitions of wireless licenses. During 2013,
2012 and 2011, we also invested $0.5 billion, $0.9 billion and $1.8 billion,
respectively, in acquisitions of investments and businesses, net of cash
acquired.
During the fourth quarter of 2013, Verizon acquired an industry leader in
content delivery networks for $0.4 billion. We expect the acquisition will
increase our ability to meet the growing demand for online digital media
content. Additionally, we acquired a technology and television cloud
companyforcashconsiderationthatwas notsignicant.InFebruary
2014, Verizon acquired a business dedicated to the development of
cloud television products and services for cash consideration that was
not signicant.
During 2012, we paid approximately $4.3 billion to acquire wireless
licenses primarily to meet future LTE capacity needs and enable LTE
expansion. Additionally, during 2012, we acquired HUGHES Telematics,
aprovideroftelematicsservices,for$0.6billion.See“Acquisitionsand
Divestitures”foradditionaldetails.
During April 2011, we paid approximately $1.4 billion for the equity of
Terremark, which was partially oset by $0.1 billion of cash acquired
(see“Acquisitionsand Divestitures”). See“CashFlowsFromFinancing
Activities”regardingthedebtobligationsofTerremarkthatwererepaid
duringMay2011.Inaddition,during2011,weacquiredvariouswireless
licenses and markets as well as a provider of cloud software technology
for cash consideration that was not signicant.
Dispositions
During2013,wecompletedthesaleof700MHzlowerBblockspectrum
licenses and as a result, we received proceeds of $2.1 billion. Additionally,
onJanuary6,2014,weannouncedagreementswithT-MobileUSA,Inc.
(T-MobileUSA)pursuanttowhichwewilldisposeofourremaining700
MHzAblockspectrumlicenses,andasaresultoftheseagreementswe
expect to receive cash consideration of approximately $2.4 billion and
additionalspectrum.See“AcquisitionsandDivestitures”foradditional
information.
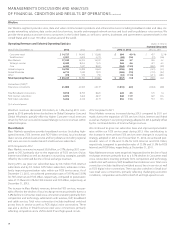
CONSOLIDATED FINANCIAL CONDITION
(dollars in millions)
Years Ended December 31, 2013 2012 2011
Cash Flows Provided By (Used In)
Operating activities $ 38,818 $ 31,486 $ 29,780
Investing activities (14,833) (20,502) (17,250)
Financingactivities 26,450 (21,253) (5,836)
Increase (Decrease) In Cash and Cash
Equivalents $ 50,435 $ (10,269) $ 6,694
We use the net cash generated from our operations to fund network
expansion and modernization, repay external nancing, pay dividends,
repurchase Verizon common stock from time to time and invest in new
businesses. Our sources of funds, primarily from operations and, to the
extent necessary, from external nancing arrangements, are sucient to
meet ongoing operating and investing requirements. The cash portion
of the purchase price for the Wireless Transaction was primarily funded
by the incurrence of third-party indebtedness, including the issuance of
$49.0 billion aggregate principal amount of xed and oating rate notes
andotherindebtedness(see“AcquisitionsandDivestitures”).Weexpect
that our capital spending requirements will continue to be nanced
primarily through internally generated funds. Debt or equity nancing
may be needed to fund additional investments or development activities
or to maintain an appropriate capital structure to ensure our nancial
exibility. Our cash and cash equivalents are primarily held domestically
in diversified accounts and are invested to maintain principal and
liquidity. Accordingly, we do not have signicant exposure to foreign
currency uctuations.
The volatility in world debt and equity markets has not had a signicant
eect on our ability to access external nancing. Our available external
nancing arrangements include credit available under credit facilities and
other bank lines of credit, vendor nancing arrangements, issuances of
registered debt or equity securities and privately-placed capital market
securities. We may also issue short-term debt through an active commer-
cial paper program and have a $6.2 billion credit facility to support such
commercial paper issuances. In addition, during 2013, we entered into a
$2.0 billion 364-day revolving credit agreement.
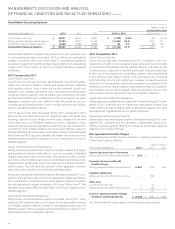
Cash Flows Provided By Operating Activities
Our primary source of funds continues to be cash generated from
operations, primarily from our Wireless segment. Net cash provided by
operating activities during 2013 increased by $7.3 billion compared to
2012 primarily due to higher consolidated earnings, lower pension con-
tributions and improved working capital levels. The increase in net cash
provided by operating activities in 2013 was partially oset by net distri-
butions of $0.3 billion received from Vodafone Omnitel in 2012.
Net cash provided by operating activities during 2012 increased by
$1.7 billion compared to 2011 primarily due to higher consolidated
earnings, as well as improved working capital levels, due to timing
dierences, partially oset by an increase in pension contributions. Net
cash provided by operating activities during 2012 and 2011 included
net distributions received from Vodafone Omnitel of $0.3 billion and $0.4
billion, respectively.
MANAGEMENT’S DISCUSSION AND ANALYSIS
OF FINANCIAL CONDITION AND RESULTS OF OPERATIONS continued