Verizon Wireless 2013 Annual Report Download - page 59
Download and view the complete annual report
Please find page 59 of the 2013 Verizon Wireless annual report below. You can navigate through the pages in the report by either clicking on the pages listed below, or by using the keyword search tool below to find specific information within the annual report.-
 1
1 -
2
-
3
-
4
-
5
-
6
-
7
-
8
-
9
-
10
-
11
-
12
-
13
-
14
-
15
-
16
-
17
-
18
-
19
-
20
-
21
-
22
-
23
-
24
-
25
-
26
-
27
-
28
-
29
-
30
-
31
-
32
-
33
-
34
-
35
-
36
-
37
-
38
-
39
-
40
-
41
-
42
-
43
-
44
-
45
-
46
-
47
-
48
-
 49
49 -
 50
50 -
 51
51 -
 52
52 -
 53
53 -
 54
54 -
 55
55 -
 56
56 -
 57
57 -
 58
58 -
 59
59 -
 60
60 -
 61
61 -
 62
62 -
 63
63 -
 64
64 -
 65
65 -
 66
66 -
 67
67 -
 68
68 -
 69
69 -
70
-
71
-
72
-
73
-
74
-
75
-
76
 |
 |

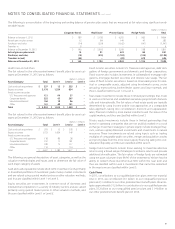
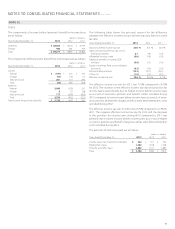
NOTES TO CONSOLIDATED FINANCIAL STATEMENTS continued
57
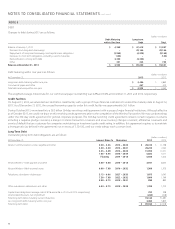
All stock options outstanding at December 31, 2013, 2012 and 2011 were
exercisable.
The following table summarizes information about Verizon’s stock options
outstanding as of December 31, 2013:
Range of
Exercise Prices
Stock Options
(in thousands)
Weighted-
Average
Remaining Life
(years)
Weighted-
Average
Exercise Price
$ 30.00–39.99 969 0.1 $ 34.18
40.00–49.99 14 0.1 46.31
Total 983 0.1 34.35
The total intrinsic value for stock options outstanding as of December 31,
2013 is not signicant. The total intrinsic value of stock options exercised
was not signicant in 2013 and the associated tax benets were not sig-
nicant in 2013, 2012 and 2011. The amount of cash received from the
exercise of stock options was $0.1 billion in 2013, $0.3 billion in 2012 and
$0.2 billion in 2011. There was no stock option expense for 2013, 2012
and 2011.
The following table summarizes the Value Appreciation Rights activity:
(shares in thousands) VARs
Weighted-
Average
Grant-Date
Fair Value
Outstanding rights, January 1, 2011 11,569 $ 13.11
Exercised (3,303) 14.87
Cancelled/Forfeited (52) 14.74
Outstanding rights, December 31, 2011 8,214 12.39
Exercised (3,427) 10.30
Cancelled/Forfeited (21) 11.10
Outstanding rights, December 31, 2012 4,766 13.89
Exercised (1,916) 13.89
Cancelled/Forfeited (3) 13.89
Outstanding rights, December 31, 2013 2,847 13.89
During 2013, 2012 and 2011, we paid $0.1 billion, respectively, to settle
VARs classied as liability awards.
Stock-Based Compensation Expense
After-tax compensation expense for stock-based compensation related
to RSUs, PSUs, and VARs described above included in Net income attrib-
utable to Verizon was $0.4 billion, $0.7 billion and $0.5 billion for 2013,
2012 and 2011, respectively.
Stock Options
The Plan provides for grants of stock options to participants at an option
price per share of no less than 100% of the fair market value of Verizon
common stock on the date of grant. Each grant has a 10-year life, vesting
equally over a three-year period, starting at the date of the grant. We
have not granted new stock options since 2004.
The following table summarizes Verizon’s stock option activity:
(shares in thousands)
Stock
Options
Weighted-
Average
Exercise
Price
Outstanding, January 1, 2011 56,844 $ 44.25
Exercised (7,104) 35.00
Cancelled/Forfeited (21,921) 51.06
Outstanding, December 31, 2011 27,819 41.24
Exercised (7,447) 35.20
Cancelled/Forfeited (17,054) 45.15
Outstanding, December 31, 2012 3,318 34.69
Exercised (2,253) 34.85
Cancelled/Forfeited (82) 34.49
Outstanding, December 31, 2013 983 34.35