Verizon Wireless 2013 Annual Report Download - page 44
Download and view the complete annual report
Please find page 44 of the 2013 Verizon Wireless annual report below. You can navigate through the pages in the report by either clicking on the pages listed below, or by using the keyword search tool below to find specific information within the annual report.-
 1
1 -
2
-
3
-
4
-
5
-
6
-
7
-
8
-
9
-
10
-
11
-
12
-
13
-
14
-
15
-
16
-
17
-
18
-
19
-
20
-
21
-
22
-
23
-
24
-
25
-
26
-
27
-
28
-
29
-
30
-
31
-
32
-
33
-
 34
34 -
 35
35 -
 36
36 -
 37
37 -
 38
38 -
 39
39 -
 40
40 -
 41
41 -
 42
42 -
 43
43 -
 44
44 -
 45
45 -
 46
46 -
 47
47 -
 48
48 -
 49
49 -
 50
50 -
 51
51 -
 52
52 -
 53
53 -
 54
54 -
55
-
56
-
57
-
58
-
59
-
60
-
61
-
62
-
63
-
64
-
65
-
66
-
67
-
68
-
69
-
70
-
71
-
72
-
73
-
74
-
75
-
76
 |
 |

42
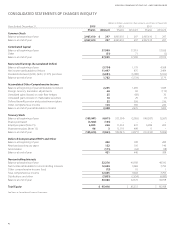
CONSOLIDATED STATEMENTS OF CHANGES IN EQUITY
(dollars in millions, except per share amounts, and shares in thousands)
Years Ended December 31, 2013 2012 2011
Shares Amount Shares Amount Shares Amount
Common Stock
Balance at beginning of year 2,967,610 $ 297 2,967,610 $ 297 2,967,610 $ 297
Balance at end of year 2,967,610 297 2,967,610 297 2,967,610 297
Contributed Capital
Balance at beginning of year 37,990 37,919 37,922
Other (51) 71 (3)
Balance at end of year 37,939 37,990 37,919
Reinvested Earnings (Accumulated Decit)
Balance at beginning of year (3,734) 1,179 4,368
Net income attributable to Verizon 11,497 875 2,404
Dividends declared ($2.09, $2.03, $1.975) per share (5,981) (5,788) (5,593)
Balance at end of year 1,782 (3,734) 1,179
Accumulated Other Comprehensive Income
Balance at beginning of year attributable to Verizon 2,235 1,269 1,049
Foreign currency translation adjustments 60 69 (119)
Unrealized gains (losses) on cash ow hedges 25 (68) 30
Unrealized gains (losses) on marketable securities 16 29 (7)
Dened benet pension and postretirement plans 22 936 316
Other comprehensive income 123 966 220
Balance at end of year attributable to Verizon 2,358 2,235 1,269
Treasury Stock
Balance at beginning of year (109,041) (4,071) (133,594) (5,002) (140,587) (5,267)
Shares purchased (3,500) (153) – – – –
Employee plans (Note 15) 6,835 260 11,434 433 6,982 265
Shareowner plans (Note 15) 96 3 13,119 498 11 –
Balance at end of year (105,610) (3,961) (109,041) (4,071) (133,594) (5,002)
Deferred Compensation-ESOPs and Other
Balance at beginning of year 440 308 200
Restricted stock equity grant 152 196 146
Amortization (171) (64) (38)
Balance at end of year 421 440 308
Noncontrolling Interests
Balance at beginning of year 52,376 49,938 48,343
Net income attributable to noncontrolling interests 12,050 9,682 7,794
Other comprehensive income (loss) (15) 10 1
Total comprehensive income 12,035 9,692 7,795
Distributions and other (7,831) (7,254) (6,200)
Balance at end of year 56,580 52,376 49,938
Total Equity $ 95,416 $ 85,533 $ 85,908
See Notes to Consolidated Financial Statements
VERIZON COMMUNICATIONS INC. AND SUBSIDIARIES