Verizon Wireless 2013 Annual Report Download - page 21
Download and view the complete annual report
Please find page 21 of the 2013 Verizon Wireless annual report below. You can navigate through the pages in the report by either clicking on the pages listed below, or by using the keyword search tool below to find specific information within the annual report.-
 1
1 -
2
-
3
-
4
-
5
-
6
-
7
-
8
-
9
-
10
-
 11
11 -
 12
12 -
 13
13 -
 14
14 -
 15
15 -
 16
16 -
 17
17 -
 18
18 -
 19
19 -
 20
20 -
 21
21 -
 22
22 -
 23
23 -
 24
24 -
 25
25 -
 26
26 -
 27
27 -
 28
28 -
 29
29 -
 30
30 -
 31
31 -
32
-
33
-
34
-
35
-
36
-
37
-
38
-
39
-
40
-
41
-
42
-
43
-
44
-
45
-
46
-
47
-
48
-
49
-
50
-
51
-
52
-
53
-
54
-
55
-
56
-
57
-
58
-
59
-
60
-
61
-
62
-
63
-
64
-
65
-
66
-
67
-
68
-
69
-
70
-
71
-
72
-
73
-
74
-
75
-
76
 |
 |

19
MANAGEMENT’S DISCUSSION AND ANALYSIS
OF FINANCIAL CONDITION AND RESULTS OF OPERATIONS continued
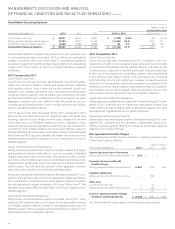
Cost of Services and Sales
Cost of services and sales decreased during 2013 compared to 2012 pri-
marily due to a decrease in cost of equipment sales of $0.4 billion, which
was partially due to a decline in postpaid upgrades, decreased data
roaming, a decline in cost of data services and a decrease in network
connection costs due to the deployment of Ethernet backhaul facili-
ties primarily targeted at sites upgrading to 4G LTE, partially oset by an
increase in cost of network services.
Cost of services and sales increased during 2012 compared to 2011 pri-
marily due to $0.7 billion in higher cost of equipment sales, which was
driven by increased sales of higher cost smartphones, increased cost of
network services and increased data roaming, partially oset by a decrease
in cost for data services, a decrease in network connection costs due to
the ongoing deployment of Ethernet backhaul facilities primarily targeted
at sites upgrading to 4G LTE and a decrease in the cost of long distance.
Selling, General and Administrative Expense
Selling, general and administrative expense increased during 2013 com-
pared to 2012 primarily due to higher sales commission expense in our
indirect channel. Indirect sales commission expense increased $1.1 bil-
lion during 2013 compared to 2012 primarily as a result of increases in
indirect gross additions and upgrades, as well as the average commission
per unit, as the mix of units continues to shift toward smartphones and
more customers activate data services.
Selling, general and administrative expense increased during 2012 com-
pared to 2011 primarily due to higher sales commission expense in our
indirect channel as well as costs associated with regulatory fees. Indirect
sales commission expense increased $1.3 billion during 2012 compared
to 2011 primarily as a result of increases in the average commission per
unit, as the mix of units continued to shift toward smartphones and more
customers activated data services.
Depreciation and Amortization Expense
The increase in depreciation and amortization expense during 2013
compared to 2012 was primarily driven by an increase in net depre-
ciable assets. Depreciation and amortization expense was essentially
unchanged during 2012 compared to 2011.
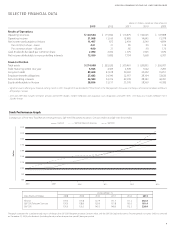
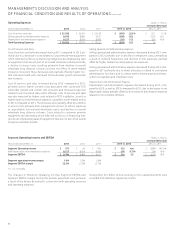
Operating Expenses (dollars in millions)
Increase/(Decrease)
Years Ended December 31, 2013 2012 2011 2013 vs. 2012 2012 vs. 2011
Cost of services and sales $ 23,648 $ 24,490 $ 24,086 $ (842) (3.4)% $ 404 1.7 %
Selling, general and administrative expense 23,176 21,650 19,579 1,526 7.0 2,071 10.6
Depreciation and amortization expense 8,202 7,960 7,962 242 3.0 (2) –
Total Operating Expenses $ 55,026 $ 54,100 $ 51,627 $ 926 1.7 $ 2,473 4.8
The changes in the table above during the periods presented were pri-
marily a result of the factors described in connection with operating
revenues and operating expenses.
Non-recurring or non-operational items excluded from Wireless’
Operating income were as follows:
(dollars in millions)
Years Ended December 31, 2013 2012 2011
Gain on spectrum license transaction $ (278) $ – $ –
Severance, pension and benet (credits)
charges (61) 37 76
$ (339) $ 37 $ 76
Segment Operating Income and EBITDA (dollars in millions)
Increase/(Decrease)
Years Ended December 31, 2013 2012 2011 2013 vs. 2012 2012 vs. 2011
Segment Operating Income $ 25,997 $ 21,768 $ 18,527 $ 4,229 19.4 % $ 3,241 17.5 %
Add Depreciation and amortization expense 8,202 7,960 7,962 242 3.0 (2) –
Segment EBITDA $ 34,199 $ 29,728 $ 26,489 $ 4,471 15.0 $ 3,239 12.2
Segment operating income margin 32.1% 28.7% 26.4%
Segment EBITDA service margin 49.5% 46.6% 44.8%