Verizon Wireless 2013 Annual Report Download - page 29
Download and view the complete annual report
Please find page 29 of the 2013 Verizon Wireless annual report below. You can navigate through the pages in the report by either clicking on the pages listed below, or by using the keyword search tool below to find specific information within the annual report.-
 1
1 -
2
-
3
-
4
-
5
-
6
-
7
-
8
-
9
-
10
-
11
-
12
-
13
-
14
-
15
-
16
-
17
-
18
-
 19
19 -
 20
20 -
 21
21 -
 22
22 -
 23
23 -
 24
24 -
 25
25 -
 26
26 -
 27
27 -
 28
28 -
 29
29 -
 30
30 -
 31
31 -
 32
32 -
 33
33 -
 34
34 -
 35
35 -
 36
36 -
 37
37 -
 38
38 -
 39
39 -
40
-
41
-
42
-
43
-
44
-
45
-
46
-
47
-
48
-
49
-
50
-
51
-
52
-
53
-
54
-
55
-
56
-
57
-
58
-
59
-
60
-
61
-
62
-
63
-
64
-
65
-
66
-
67
-
68
-
69
-
70
-
71
-
72
-
73
-
74
-
75
-
76
 |
 |

27
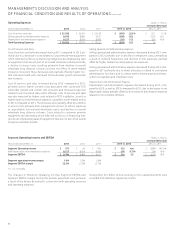
Free Cash Flow
Freecashowisanon-GAAPnancialmeasurethatmanagementbelieves
isusefultoinvestorsandotherusersofVerizon’snancialinformationin
evaluatingcashavailabletopaydebtanddividends.Freecashowiscal-
culated by subtracting capital expenditures from net cash provided by
operating activities. The following table reconciles net cash provided by
operatingactivitiestoFreecashow:
(dollars in millions)
Years Ended December 31, 2013 2012 2011
Net cash provided by operating activities $ 38,818 $ 31,486 $ 29,780
Less Capital expenditures (including
capitalized software) 16,604 16,175 16,244
Free cash ow $ 22,214 $ 15,311 $ 13,536
The changes in free cash ow during 2013, 2012 and 2011 were a result of
the factors described in connection with net cash provided by operating
activities and capital expenditures.
Employee Benet Plan Funded Status and Contributions
Pension Annuitization
On October 17, 2012, we, along with our subsidiary Verizon Investment
ManagementCorp.,andFiduciaryCounselorsInc.,asindependentdu-
ciaryoftheVerizonManagementPensionPlan(thePlan),enteredintoa
denitive purchase agreement with The Prudential Insurance Company
ofAmerica(Prudential)andPrudentialFinancial,Inc.,pursuanttowhich
the Plan would purchase a single premium group annuity contract
from Prudential.
On December 10, 2012, upon issuance of the group annuity contract by
Prudential, Prudential irrevocably assumed the obligation to make future
annuity payments to approximately 41,000 Verizon management retirees
who began receiving pension payments from the Plan prior to January 1,
2010.Theamountofeachretiree’sannuitypaymentequalstheamountof
suchindividual’spensionbenet.Inaddition,thegroupannuitycontract
is intended to replicate the same rights to future payments, such as sur-
vivor benets, that are currently oered by the Plan.
We contributed approximately $2.6 billion to the Plan between September
1, 2012 and December 31, 2012 in connection with the transaction so
thatthe Plan’sfundingpercentagewouldnotdecreaseas aresultof
the transaction.
Employer Contributions
We operate numerous qualied and nonqualied pension plans and other
postretirement benet plans. These plans primarily relate to our domestic
business units. During 2013, contributions to our qualied pension plans
were not material. During 2012 and 2011, we contributed $0.9 billion and
$0.4 billion, respectively, to our qualied pension plans, excluding the
pension annuitization discussed above. We also contributed $0.1 billion,
$0.2 billion and $0.1 billion to our nonqualied pension plans in 2013,
2012 and 2011, respectively.
In an eort to reduce the risk of our portfolio strategy and better align
assets with liabilities, we have adopted a liability driven pension strategy
that seeks to better match cash ows from investments with projected
benet payments. We expect that the strategy will reduce the likelihood
that assets will decline at a time when liabilities increase (referred to as
liability hedging), with the goal to reduce the risk of underfunding to the
plan and its participants and beneciaries, however, we also expect the
strategytoresultinlowerassetreturns.Basedonthisstrategyandthe
funded status of the plans at December 31, 2013, we expect the min-
imum required qualied pension plan contribution in 2014 to be $1.2
billion. Nonqualied pension contributions are estimated to be approxi-
mately $0.2 billion in 2014.
Common Stock
Common stock has been used from time to time to satisfy some of the
funding requirements of employee and shareowner plans, including 24.6
million common shares issued from Treasury stock during 2012, related
to dividend payments, which had an aggregate value of $1.0 billion. On
February3,2011,theBoardofDirectorsreplacedthepreviouslyautho-
rized share buyback program with a new program for the repurchase of
up to 100 million common shares terminating no later than the close
ofbusinessonFebruary28,2014.TheBoardalsodeterminedthatno
additional shares were to be purchased under the prior program. During
2013, we repurchased $0.2 billion of our common stock under this pro-
gram. There were no repurchases of common stock during 2012 or 2011.
As a result of the Wireless Transaction, Verizon issued approximately 1.27
billion shares.
Credit Ratings
Duringthethirdquarterof 2013,Verizon’s creditratingsweredown-
gradedbyMoody’sInvestorsService(Moody’s),Standard&Poor’sRatings
Services(Standard&Poor’s)andFitchRatings(Fitch)asaresultofVerizon’s
announcementoftheagreementtoacquireVodafone’s45%noncontrol-
ling interest in Verizon Wireless for approximately $130 billion including
the incurrence of third-party indebtedness to fund the cash portion of the
purchasepricefortheWirelessTransaction.Moody’sdowngradedVerizon’s
long-termdebtratingsonenotchfromA3 toBaa1,whileStandard &
Poor’s loweredits corporatecreditratingandseniorunsecureddebt
ratingonenotchfromA-toBBB+andFitchlowereditslong-termissuer
default rating and senior unsecured debt rating one notch from A to A-.
Although the ratings downgrade is not expected to signicantly impact
our access to capital, it could increase both the cost of renancing debt
and the cost of nancing any new capital requirements. Securities rat-
ings assigned by rating organizations are expressions of opinion and are
not recommendations to buy, sell or hold securities. A securities rating
is subject to revision or withdrawal at any time by the assigning rating
organization. Each rating should be evaluated independently of any
other rating.
Covenants
Our credit agreements contain covenants that are typical for large,
investment grade companies. These covenants include requirements to
pay interest and principal in a timely fashion, pay taxes, maintain insur-
ance with responsible and reputable insurance companies, preserve our
corporate existence, keep appropriate books and records of nancial
transactions, maintain our properties, provide nancial and other reports
to our lenders, limit pledging and disposition of assets and mergers and
consolidations, and other similar covenants. Additionally, the term loan
credit agreement and the 364-day revolving credit agreement require us
to maintain a leverage ratio (as such term is dened in those agreements)
not in excess of 3.50:1.00 until our credit ratings are equal to or higher
than A3 and A-.
We and our consolidated subsidiaries are in compliance with all debt
covenants.
Increase (Decrease) In Cash and Cash Equivalents
Our Cash and cash equivalents at December 31, 2013 totaled $53.5 bil-
lion, a $50.4 billion increase compared to Cash and cash equivalents at
December 31, 2012 primarily as a result of the issuance of $49.0 billion
aggregate principal amount of xed and oating rate notes.
Our Cash and cash equivalents at December 31, 2012 totaled $3.1 bil-
lion, a $10.3 billion decrease compared to Cash and cash equivalents at
December 31, 2011 as a result of the factors described in connection
with our cash ows provided by operating activities, cash ows used in
investing activities and cash ows used in nancing activities.
MANAGEMENT’S DISCUSSION AND ANALYSIS
OF FINANCIAL CONDITION AND RESULTS OF OPERATIONS continued