Verizon Wireless 2013 Annual Report Download - page 62
Download and view the complete annual report
Please find page 62 of the 2013 Verizon Wireless annual report below. You can navigate through the pages in the report by either clicking on the pages listed below, or by using the keyword search tool below to find specific information within the annual report.-
 1
1 -
2
-
3
-
4
-
5
-
6
-
7
-
8
-
9
-
10
-
11
-
12
-
13
-
14
-
15
-
16
-
17
-
18
-
19
-
20
-
21
-
22
-
23
-
24
-
25
-
26
-
27
-
28
-
29
-
30
-
31
-
32
-
33
-
34
-
35
-
36
-
37
-
38
-
39
-
40
-
41
-
42
-
43
-
44
-
45
-
46
-
47
-
48
-
49
-
50
-
51
-
 52
52 -
 53
53 -
 54
54 -
 55
55 -
 56
56 -
 57
57 -
 58
58 -
 59
59 -
 60
60 -
 61
61 -
 62
62 -
 63
63 -
 64
64 -
 65
65 -
 66
66 -
 67
67 -
 68
68 -
 69
69 -
 70
70 -
 71
71 -
 72
72 -
73
-
74
-
75
-
76
 |
 |

NOTES TO CONSOLIDATED FINANCIAL STATEMENTS continued
60
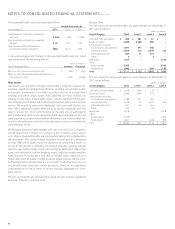
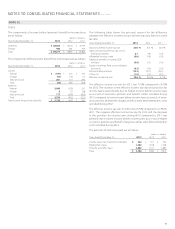
The assumed health care cost trend rates follow:
Health Care and Life
At December 31, 2013 2012 2011
Healthcare cost trend rate assumed for
next year 6.50 % 7.00 % 7.50 %
Rate to which cost trend rate gradually
declines 4.75 5.00 5.00
Year the rate reaches the level it is
assumed to remain thereafter 2020 2016 2016
A one-percentage point change in the assumed health care cost trend
rate would have the following eects:
(dollars in millions)
One-Percentage Point Increase Decrease
Eect on 2013 service and interest cost $ 184 $ (150)
Eect on postretirement benet obligation as of
December 31, 2013 2,539 (2,086)
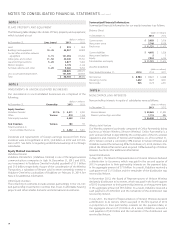
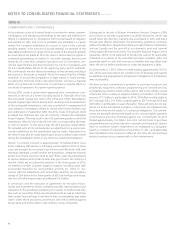
Plan Assets
Historically, our portfolio strategy emphasized a long-term equity ori-
entation, signicant global diversication, and the use of both public
and private investments. In an eort to reduce the risk of our portfolio
strategy and better align assets with liabilities, we have shifted our
strategy to one that is more liability driven, where cash ows from invest-
ments better match projected benet payments but result in lower asset
returns. We intend to reduce the likelihood that assets will decline at a
time when liabilities increase (referred to as liability hedging), with the
goal to reduce the risk of underfunding to the plan and its participants
and beneciaries. Both active and passive management approaches are
used depending on perceived market eciencies and various other fac-
tors. Our diversication and risk control processes serve to minimize the
concentration of risk.
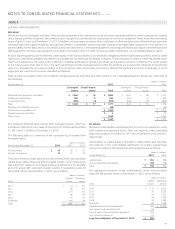
While target allocation percentages will vary over time, the company’s
overall investment strategy is to achieve a mix of assets, which allows
us to meet projected benets payments while taking into consideration
risk and return. The current target allocation for plan assets is designed
so that 70% of the assets have the objective of achieving a return in
excess of the growth in liabilities (comprised of public equities, private
equities, real estate, hedge funds and emerging debt) and 30% of the
assets are invested as liability hedging assets (typically longer duration
xed income). This allocation will shift as funded status improves to a
higher allocation to liability hedging assets. Target policies will be revis-
ited periodically to ensure they are in line with fund objectives. Due to
our diversication and risks control processes, there are no signicant
concentrations of risk, in terms of sector, industry, geography or com-
pany names.
Pension and healthcare and life plans assets do not include signicant
amounts of Verizon common stock.
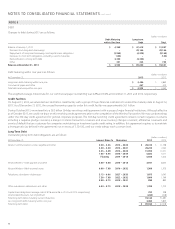
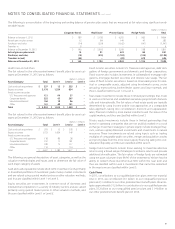
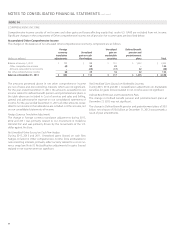
Pension Plans
The fair values for the pension plans by asset category at December 31,
2013 are as follows:
(dollars in millions)
Asset Category Total Level 1 Level 2 Level 3
Cash and cash equivalents $ 968 $ 881 $ 87 $ –
Equity securities 4,200 3,300 900 –
Fixed income securities
U.S. Treasuries and agencies 1,097 691 406 –
Corporate bonds 2,953 212 2,579 162
International bonds 364 51 313 –
Other 3 – 3 –
Real estate 1,784 – – 1,784
Other
Private equity 3,942 – – 3,942
Hedge funds 1,800 – 604 1,196
Total $ 17,111 $ 5,135 $ 4,892 $ 7,084
The fair values for the pension plans by asset category at December 31,
2012 are as follows:
(dollars in millions)
Asset Category Total Level 1 Level 2 Level 3
Cash and cash equivalents $ 1,618 $ 1,586 $ 32 $ –
Equity securities 2,944 2,469 475 –
Fixed income securities
U.S. Treasuries and agencies 1,589 1,125 464 –
Corporate bonds 2,456 35 2,225 196
International bonds 601 140 461 –
Other 210 – 210 –
Real estate 2,018 – – 2,018
Other
Private equity 5,039 – – 5,039
Hedge funds 1,807 – 1,249 558
Total $ 18,282 $ 5,355 $ 5,116 $ 7,811