Verizon Wireless 2013 Annual Report Download - page 51
Download and view the complete annual report
Please find page 51 of the 2013 Verizon Wireless annual report below. You can navigate through the pages in the report by either clicking on the pages listed below, or by using the keyword search tool below to find specific information within the annual report.-
 1
1 -
2
-
3
-
4
-
5
-
6
-
7
-
8
-
9
-
10
-
11
-
12
-
13
-
14
-
15
-
16
-
17
-
18
-
19
-
20
-
21
-
22
-
23
-
24
-
25
-
26
-
27
-
28
-
29
-
30
-
31
-
32
-
33
-
34
-
35
-
36
-
37
-
38
-
39
-
40
-
 41
41 -
 42
42 -
 43
43 -
 44
44 -
 45
45 -
 46
46 -
 47
47 -
 48
48 -
 49
49 -
 50
50 -
 51
51 -
 52
52 -
 53
53 -
 54
54 -
 55
55 -
 56
56 -
 57
57 -
 58
58 -
 59
59 -
 60
60 -
 61
61 -
62
-
63
-
64
-
65
-
66
-
67
-
68
-
69
-
70
-
71
-
72
-
73
-
74
-
75
-
76
 |
 |

49
NOTES TO CONSOLIDATED FINANCIAL STATEMENTS continued
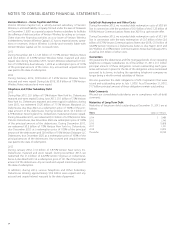
The amortization expense for Other intangible assets was as follows:
Years (dollars in millions)
2013 $ 1,587
2012 1,540
2011 1,505
Estimated annual amortization expense for Other intangible assets is as
follows:
Years (dollars in millions)
2014 $ 1,486
2015 1,215
2016 971
2017 784
2018 619
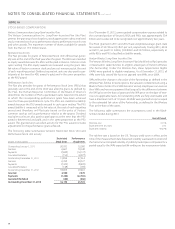
NOTE 3
WIRELESS LICENSES, GOODWILL AND OTHER INTANGIBLE ASSETS
Wireless Licenses
Changes in the carrying amount of Wireless licenses are as follows:
(dollars in millions)
Balance at January 1, 2012 $ 73,250
Acquisitions (Note 2) 4,544
Capitalized interest on wireless licenses 205
Reclassications, adjustments and other (255)
Balance at December 31, 2012 $ 77,744
Acquisitions (Note 2) 579
Dispositions (Note 2) (2,361)
Capitalized interest on wireless licenses 566
Reclassications, adjustments and other (781)
Balance at December 31, 2013 $ 75,747
Reclassications, adjustments and other includes $0.9 billion of Wireless licenses that are classied as held for sale and included in Prepaid expenses
and other on our consolidated balance sheet at December 31, 2013 as well as the exchanges of wireless licenses in 2013 and 2012. See Note 2 for
additional details.
At December 31, 2013 and 2012, approximately $7.7 billion and $7.3 billion, respectively, of wireless licenses were under development for commercial
service for which we were capitalizing interest costs.
The average remaining renewal period of our wireless license portfolio was 5.1 years as of December 31, 2013. See Note 1 for additional details.
Goodwill
Changes in the carrying amount of Goodwill are as follows:
(dollars in millions)
Wireless Wireline Total
Balance at January 1, 2012 $ 17,963 $ 5,394 $ 23,357
Acquisitions (Note 2) 209 551 760
Reclassications, adjustments and other – 22 22
Balance at December 31, 2012 $ 18,172 $ 5,967 $ 24,139
Acquisitions (Note 2) 204 291 495
Balance at December 31, 2013 $ 18,376 $ 6,258 $ 24,634
The increase in Goodwill at Wireless at December 31, 2013 was primarily due to obtaining control of previously unconsolidated wireless partnerships,
which were previously accounted for under the equity method and are now consolidated. This resulted in an immaterial gain recorded during the year
ended December 31, 2013. The increase in Goodwill at Wireline at December 31, 2013 was primarily due to the acquisition of a provider of content
delivery networks.
Other Intangible Assets
The following table displays the composition of Other intangible assets, net:
(dollars in millions)
2013 2012
At December 31,
Gross
Amount
Accumulated
Amortization
Net
Amount
Gross
Amount
Accumulated
Amortization
Net
Amount
Customer lists (5 to 13 years) $ 3,639 $ (2,660) $ 979 $ 3,556 $ (2,338) $ 1,218
Non-network internal-use software (3 to 7 years) 11,770 (7,317) 4,453 10,415 (6,210) 4,205
Other (2 to 25 years) 691 (323) 368 802 (292) 510
Total $ 16,100 $ (10,300) $ 5,800 $ 14,773 $ (8,840) $ 5,933