Verizon Wireless 2013 Annual Report Download - page 19
Download and view the complete annual report
Please find page 19 of the 2013 Verizon Wireless annual report below. You can navigate through the pages in the report by either clicking on the pages listed below, or by using the keyword search tool below to find specific information within the annual report.-
 1
1 -
2
-
3
-
4
-
5
-
6
-
7
-
8
-
 9
9 -
 10
10 -
 11
11 -
 12
12 -
 13
13 -
 14
14 -
 15
15 -
 16
16 -
 17
17 -
 18
18 -
 19
19 -
 20
20 -
 21
21 -
 22
22 -
 23
23 -
 24
24 -
 25
25 -
 26
26 -
 27
27 -
 28
28 -
 29
29 -
30
-
31
-
32
-
33
-
34
-
35
-
36
-
37
-
38
-
39
-
40
-
41
-
42
-
43
-
44
-
45
-
46
-
47
-
48
-
49
-
50
-
51
-
52
-
53
-
54
-
55
-
56
-
57
-
58
-
59
-
60
-
61
-
62
-
63
-
64
-
65
-
66
-
67
-
68
-
69
-
70
-
71
-
72
-
73
-
74
-
75
-
76
 |
 |

17
SEGMENT RESULTS OF OPERATIONS
We have two reportable segments, Wireless and Wireline, which we operate and manage as strategic business units and organize by products and
services. We measure and evaluate our reportable segments based on segment operating income. The use of segment operating income is consistent
withthechiefoperatingdecisionmaker’sassessmentofsegmentperformance.
Segmentearningsbeforeinterest,taxes,depreciationandamortization(SegmentEBITDA),whichispresentedbelow,isanon-GAAPmeasureand
doesnotpurporttobeanalternativetooperatingincomeasameasureofoperatingperformance.Managementbelievesthatthismeasureisuseful
to investors and other users of our nancial information in evaluating operating protability on a more variable cost basis as it excludes the depre-
ciation and amortization expenses related primarily to capital expenditures and acquisitions that occurred in prior years, as well as in evaluating
operatingperformanceinrelationtoourcompetitors.SegmentEBITDAiscalculatedbyaddingbackdepreciationandamortizationexpensetoseg-
ment operating income.
WirelessSegmentEBITDAservicemargin,alsopresentedbelow,iscalculatedbydividingWirelessSegmentEBITDAbyWirelessservicerevenues.
WirelessSegmentEBITDAservicemarginutilizesservicerevenuesratherthantotalrevenues.Servicerevenuesprimarilyexcludeequipmentrevenues
inordertoreecttheimpactofprovidingservicetothewirelesscustomerbaseonanongoingbasis.WirelineEBITDAmarginiscalculatedbydividing
WirelineEBITDAbytotalWirelinerevenues.YoucanndadditionalinformationaboutoursegmentsinNote13totheconsolidatednancialstatements.
Wireless
Our Wireless segment is primarily comprised of Cellco Partnership doing business as Verizon Wireless. Cellco Partnership is a joint venture formed in
April 2000 by the combination of the U.S. wireless operations and interests of Verizon and Vodafone. Verizon Wireless provides wireless communica-
tions services across one of the most extensive wireless networks in the United States. As of December 31, 2013, Verizon owned a controlling 55%
interestinVerizonWirelessandVodafoneownedtheremaining45%.OnFebruary21,2014,theWirelessTransactionwascompleted,andVerizon
acquired 100% ownership of Verizon Wireless.
We provide these services and equipment sales to consumer, business and government customers in the United States on a postpaid and prepaid
basis. Postpaid connections represent individual lines of service for which a customer is billed in advance a monthly access charge in return for a
monthly network service allowance, and usage beyond the allowance is billed monthly in arrears. Our prepaid service enables individuals to obtain
wireless services without a long-term contract or credit verication by paying for all services in advance.
All nancial results included in the tables below reect the consolidated results of Verizon Wireless.
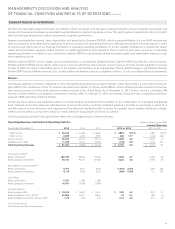
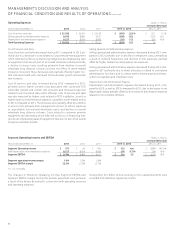
Operating Revenues and Selected Operating Statistics (dollarsinmillions,exceptARPA)
Increase/(Decrease)
Years Ended December 31, 2013 2012 2011 2013 vs. 2012 2012 vs. 2011
Retailservice $ 66,334 $ 61,440 $ 56,660 $ 4,894 8.0 % $ 4,780 8.4 %
Other service 2,699 2,293 2,497 406 17.7 (204) (8.2)
Service revenue 69,033 63,733 59,157 5,300 8.3 4,576 7.7
Equipment and other 11,990 12,135 10,997 (145) (1.2) 1,138 10.3
Total Operating Revenues $ 81,023 $ 75,868 $ 70,154 $ 5,155 6.8 $ 5,714 8.1
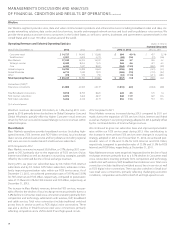
Connections ('000):(1)
Retailconnections 102,799 98,230 92,167 4,569 4.7 6,063 6.6
Retailpostpaidconnections 96,752 92,530 87,382 4,222 4.6 5,148 5.9
Net additions in period ('000):(2)
Retailconnections 4,472 5,917 4,624 (1,445) (24.4) 1,293 28.0
Retailpostpaidconnections 4,118 5,024 4,252 (906) (18.0) 772 18.2
ChurnRate:
Retailconnections 1.27% 1.19% 1.26%
Retailpostpaidconnections 0.97% 0.91% 0.95%
Account Statistics:
RetailpostpaidARPA $ 153.93 $ 144.04 $ 134.51 $ 9.89 6.9 $ 9.53 7.1
Retailpostpaidaccounts('000):(1) 35,083 35,057 34,561 26 0.1 496 1.4
Retailpostpaidconnectionsperaccount(1) 2.76 2.64 2.53 0.12 4.5 0.11 4.3
(1) As of end of period
(2) Excluding acquisitions and adjustments
MANAGEMENT’S DISCUSSION AND ANALYSIS
OF FINANCIAL CONDITION AND RESULTS OF OPERATIONS continued