Verizon Wireless 2013 Annual Report Download - page 24
Download and view the complete annual report
Please find page 24 of the 2013 Verizon Wireless annual report below. You can navigate through the pages in the report by either clicking on the pages listed below, or by using the keyword search tool below to find specific information within the annual report.-
 1
1 -
2
-
3
-
4
-
5
-
6
-
7
-
8
-
9
-
10
-
11
-
12
-
13
-
 14
14 -
 15
15 -
 16
16 -
 17
17 -
 18
18 -
 19
19 -
 20
20 -
 21
21 -
 22
22 -
 23
23 -
 24
24 -
 25
25 -
 26
26 -
 27
27 -
 28
28 -
 29
29 -
 30
30 -
 31
31 -
 32
32 -
 33
33 -
 34
34 -
35
-
36
-
37
-
38
-
39
-
40
-
41
-
42
-
43
-
44
-
45
-
46
-
47
-
48
-
49
-
50
-
51
-
52
-
53
-
54
-
55
-
56
-
57
-
58
-
59
-
60
-
61
-
62
-
63
-
64
-
65
-
66
-
67
-
68
-
69
-
70
-
71
-
72
-
73
-
74
-
75
-
76
 |
 |

22
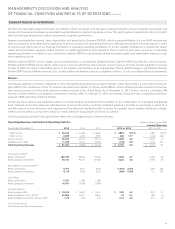
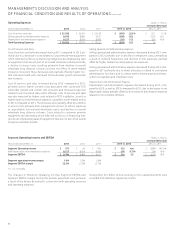
Operating Expenses (dollars in millions)
Increase/(Decrease)
Years Ended December 31, 2013 2012 2011 2013 vs. 2012 2012 vs. 2011
Cost of services and sales $ 21,928 $ 22,413 $ 22,158 $ (485) (2.2)% $ 255 1.2 %
Selling, general and administrative expense 8,595 8,883 9,107 (288) (3.2) (224) (2.5)
Depreciation and amortization expense 8,327 8,424 8,458 (97) (1.2) (34) (0.4)
Total Operating Expenses $ 38,850 $ 39,720 $ 39,723 $ (870) (2.2) $ (3) –
Selling, General and Administrative Expense
Selling, general and administrative expense decreased during 2013 com-
pared to 2012 primarily due to declines in employee costs, primarily as
a result of reduced headcount, and declines in rent expenses, partially
oset by higher transaction and property tax expenses.
Selling, general and administrative expense decreased during 2012 com-
pared to 2011 primarily due to lower allocations related to centralized
administrative functions, and to a lesser extent, lower property and trans-
action tax expenses and employee costs.
Depreciation and Amortization Expense
Depreciation and amortization expense decreased during 2013 com-
pared to 2012, as well as 2012 compared to 2011, due to decreases in net
depreciable assets, partially oset by an increase in amortization expense
related to non-network software.
Cost of Services and Sales
Cost of services and sales decreased during 2013 compared to 2012, pri-
marily due to a decrease in costs related to customer premise equipment
which reected our focus on improving margins by de-emphasizing sales
of equipment that are not part of an overall enterprise solutions bundle,
a decline in access costs resulting primarily from declines in overall
wholesale long distance volumes and the net eect of storm-related
insurance recoveries. These decreases were partially oset by higher con-
tentcostsassociatedwithcontinuedFiOSsubscribergrowthandvendor
rate increases.
Cost of services and sales increased during 2012 compared to 2011,
primarilyduetohighercontentcostsassociatedwithcontinuedFiOS
subscriber growth and vendor rate increases and increased expenses
related to our cloud and data center oerings. Cost of services and sales
wasalsoimpactedbyhighercostsrelatedtoFiOSinstallation,aswellas
higher repair and maintenance expenses caused by storm-related events
in 2012 compared to 2011. The increases were partially oset by a decline
in access costs primarily from management actions to reduce exposure
to unprotable international wholesale routes and declines in overall
wholesale long distance volumes. Costs related to customer premise
equipment also decreased, which reected our focus on improving mar-
gins by de-emphasizing sales of equipment that are not part of an overall
enterprise solutions bundle.
The changes inWireline’s Operating income, Segment EBITDA and
SegmentEBITDAmarginduringtheperiodspresentedwereprimarily
a result of the factors described in connection with operating revenues
and operating expenses.
During 2012, $0.1 billion of non-recurring or non-operational items were
excludedfromWireline’sOperatingincome.
MANAGEMENT’S DISCUSSION AND ANALYSIS
OF FINANCIAL CONDITION AND RESULTS OF OPERATIONS continued
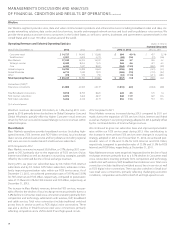
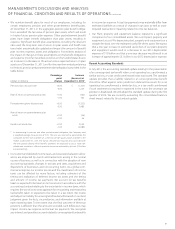
Segment Operating Income and EBITDA (dollars in millions)
Increase/(Decrease)
Years Ended December 31, 2013 2012 2011 2013 vs. 2012 2012 vs. 2011
Segment Operating Income $ 373 $ 60 $ 959 $ 313 nm $ (899) (93.7)%
Add Depreciation and amortization expense 8,327 8,424 8,458 (97) (1.2)% (34) (0.4)
Segment EBITDA $ 8,700 $ 8,484 $ 9,417 $ 216 2.5 $ (933) (9.9)
Segment operating income margin 1.0% 0.2% 2.4%
Segment EBITDA margin 22.2% 21.3% 23.1%
nm - not meaningful