Siemens 2009 Annual Report Download - page 142
Download and view the complete annual report
Please find page 142 of the 2009 Siemens annual report below. You can navigate through the pages in the report by either clicking on the pages listed below, or by using the keyword search tool below to find specific information within the annual report.-
 1
1 -
2
-
3
-
4
-
5
-
6
-
7
-
8
-
9
-
10
-
11
-
12
-
13
-
14
-
15
-
16
-
17
-
18
-
19
-
20
-
21
-
22
-
23
-
24
-
25
-
26
-
27
-
28
-
29
-
30
-
31
-
32
-
33
-
34
-
35
-
36
-
37
-
38
-
39
-
40
-
41
-
42
-
43
-
44
-
45
-
46
-
47
-
48
-
49
-
50
-
51
-
52
-
53
-
54
-
55
-
56
-
57
-
58
-
59
-
60
-
61
-
62
-
63
-
64
-
65
-
66
-
67
-
68
-
69
-
70
-
71
-
72
-
73
-
74
-
75
-
76
-
77
-
78
-
79
-
80
-
81
-
82
-
83
-
84
-
85
-
86
-
87
-
88
-
89
-
90
-
91
-
92
-
93
-
94
-
95
-
96
-
97
-
98
-
99
-
100
-
101
-
102
-
103
-
104
-
105
-
106
-
107
-
108
-
109
-
110
-
111
-
112
-
113
-
114
-
115
-
116
-
117
-
118
-
119
-
120
-
121
-
122
-
123
-
124
-
125
-
126
-
127
-
128
-
129
-
130
-
131
-
 132
132 -
 133
133 -
 134
134 -
 135
135 -
 136
136 -
 137
137 -
 138
138 -
 139
139 -
 140
140 -
 141
141 -
 142
142 -
 143
143 -
 144
144 -
 145
145 -
 146
146 -
 147
147 -
 148
148 -
 149
149 -
 150
150 -
 151
151 -
 152
152 -
153
-
154
-
155
-
156
-
157
-
158
-
159
-
160
-
161
-
162
-
163
-
164
-
165
-
166
-
167
-
168
-
169
-
170
-
171
-
172
-
173
-
174
-
175
-
176
-
177
-
178
-
179
-
180
-
181
-
182
-
183
-
184
-
185
-
186
-
187
-
188
-
189
-
190
-
191
-
192
-
193
-
194
-
195
-
196
-
197
-
198
-
199
-
200
-
201
-
202
-
203
-
204
-
205
-
206
-
207
-
208
-
209
-
210
-
211
-
212
-
213
-
214
-
215
-
216
-
217
-
218
-
219
-
220
-
221
-
222
-
223
-
224
-
225
-
226
-
227
-
228
-
229
-
230
-
231
-
232
-
233
-
234
-
235
-
236
-
237
-
238
-
239
-
240
-
241
-
242
-
243
-
244
-
245
-
246
-
247
-
248
-
249
-
250
-
251
-
252
-
253
-
254
-
255
-
256
-
257
-
258
-
259
-
260
-
261
-
262
-
263
-
264
-
265
-
266
-
267
-
268
-
269
-
270
-
271
-
272
-
273
-
274
-
275
-
276
-
277
-
278
-
279
-
280
-
281
-
282
-
283
-
284
-
285
-
286
-
287
-
288
-
289
-
290
-
291
-
292
-
293
-
294
-
295
-
296
-
297
-
298
-
299
-
300
-
301
-
302
-
303
-
304
-
305
-
306
-
307
-
308
-
309
-
310
-
311
-
312
-
313
-
314
-
315
-
316
-
317
-
318
-
319
-
320
-
321
-
322
 |
 |

4
Reports Supervisory Board /
Managing Board Corporate Governance Management’s discussion and analysis Consolidated Financial Statements
44 Business and operating environment 63 Fiscal 2009 – Financial summary 66 Results of operations 84 Financial position
profit for these businesses is defined as earnings before
financing interest, certain pension costs, and income taxes,
and also may exclude various categories of items, which are
not allocated to these businesses since Management does not
regard such items as indicative of their performance. In fiscal
2009, profit of the Diagnostics Division and the Healthcare
Sector is adjusted for purchase price accounting (PPA) effects
and integration costs for comparison with the margin ranges.
In contrast, and in line with common practice in the financial
services industry, the profitability measure for SFS is return on
equity, defined as Income before income taxes divided by the
average allocated equity for SFS. Our target ranges and the fis-
cal 2009 performances of our Sectors, Divisions and Cross-
Sector Businesses, are shown below.
Operational performance measures
The first of our operational performance measures focuses on
growth, in order to ensure the revenue development required
to produce income growth. Our goal for the current fiscal year
was to grow annual organic revenue at twice the rate of global
GDP growth. In case of negative GDP growth, this means that a
percentage decline in annual organic revenue for Siemens was
targeted at less than half the rate of decline in global GDP.
Our primary measure for the conversion of revenue growth to
income growth is profit margin, applied and reported at the
Sector, Division and Cross-Sector Business level. For our Sec-
tors, Divisions and for Siemens IT Solutions and Services, profit
margin is calculated as the ratio of profit to revenue, while
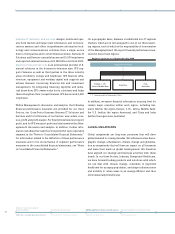
Growth
Value Generation
Liquidity
Profitability/
Capital
efficiency
B25G007_E
Revenue growth
FY 2009 0%
FY 2008 9%
Target 2009: < 0.5 GDP decline. As of October 14, 2009, IHS Global Insight Inc. expects
negative growth of 2.1% in GDP in 2009.
1 Excluding currency translation and portfolio effects.
Revenue current period1
– 1 × 100%
Revenue prior-year period
B25G008_E
Profit margin fiscal year
Margin Target
range
Industry 7.7% 9 – 13%
Industry Automation 9.1% 12 – 17%
Drive Technologies 11.1% 11 – 16%
Building Technologies 6.4% 7 – 10%
OSRAM 2.2% 10 – 12%
Industry Solutions 5.3% 5 – 7%
Mobility 6.1% 5 – 7%
Energy 12.9% 11 – 15%
Fossil Power Generation 13.0% 11 – 15%
Renewable Energy 13.0% 12 – 16%
Oil & Gas 11.7% 10 – 14%
Power Transmission 11.7% 10 – 14%
Power Distribution 13.2% 11 – 15%
Healthcare 14.2% 14 – 17%
Imaging & IT 16.2% 14 – 17%
Workflow & Solutions (3.5)% 11 – 14%
Diagnostics 16.8% 16 – 19%
Siemens IT Solutions
and Services 1.9% 5 – 7%
Siemens Financial
Services 25.9% 20 – 23%
Target range
1 Profit margin including PPA effects and integration costs for Healthcare is 12.2%
and for Diagnostics 9.7%.
2 Return on equity.
Profit
× 100%
Revenue
B25G009_E