Siemens 2009 Annual Report Download - page 90
Download and view the complete annual report
Please find page 90 of the 2009 Siemens annual report below. You can navigate through the pages in the report by either clicking on the pages listed below, or by using the keyword search tool below to find specific information within the annual report.-
 1
1 -
2
-
3
-
4
-
5
-
6
-
7
-
8
-
9
-
10
-
11
-
12
-
13
-
14
-
15
-
16
-
17
-
18
-
19
-
20
-
21
-
22
-
23
-
24
-
25
-
26
-
27
-
28
-
29
-
30
-
31
-
32
-
33
-
34
-
35
-
36
-
37
-
38
-
39
-
40
-
41
-
42
-
43
-
44
-
45
-
46
-
47
-
48
-
49
-
50
-
51
-
52
-
53
-
54
-
55
-
56
-
57
-
58
-
59
-
60
-
61
-
62
-
63
-
64
-
65
-
66
-
67
-
68
-
69
-
70
-
71
-
72
-
73
-
74
-
75
-
76
-
77
-
78
-
79
-
 80
80 -
 81
81 -
 82
82 -
 83
83 -
 84
84 -
 85
85 -
 86
86 -
 87
87 -
 88
88 -
 89
89 -
 90
90 -
 91
91 -
 92
92 -
 93
93 -
 94
94 -
 95
95 -
 96
96 -
 97
97 -
 98
98 -
 99
99 -
 100
100 -
101
-
102
-
103
-
104
-
105
-
106
-
107
-
108
-
109
-
110
-
111
-
112
-
113
-
114
-
115
-
116
-
117
-
118
-
119
-
120
-
121
-
122
-
123
-
124
-
125
-
126
-
127
-
128
-
129
-
130
-
131
-
132
-
133
-
134
-
135
-
136
-
137
-
138
-
139
-
140
-
141
-
142
-
143
-
144
-
145
-
146
-
147
-
148
-
149
-
150
-
151
-
152
-
153
-
154
-
155
-
156
-
157
-
158
-
159
-
160
-
161
-
162
-
163
-
164
-
165
-
166
-
167
-
168
-
169
-
170
-
171
-
172
-
173
-
174
-
175
-
176
-
177
-
178
-
179
-
180
-
181
-
182
-
183
-
184
-
185
-
186
-
187
-
188
-
189
-
190
-
191
-
192
-
193
-
194
-
195
-
196
-
197
-
198
-
199
-
200
-
201
-
202
-
203
-
204
-
205
-
206
-
207
-
208
-
209
-
210
-
211
-
212
-
213
-
214
-
215
-
216
-
217
-
218
-
219
-
220
-
221
-
222
-
223
-
224
-
225
-
226
-
227
-
228
-
229
-
230
-
231
-
232
-
233
-
234
-
235
-
236
-
237
-
238
-
239
-
240
-
241
-
242
-
243
-
244
-
245
-
246
-
247
-
248
-
249
-
250
-
251
-
252
-
253
-
254
-
255
-
256
-
257
-
258
-
259
-
260
-
261
-
262
-
263
-
264
-
265
-
266
-
267
-
268
-
269
-
270
-
271
-
272
-
273
-
274
-
275
-
276
-
277
-
278
-
279
-
280
-
281
-
282
-
283
-
284
-
285
-
286
-
287
-
288
-
289
-
290
-
291
-
292
-
293
-
294
-
295
-
296
-
297
-
298
-
299
-
300
-
301
-
302
-
303
-
304
-
305
-
306
-
307
-
308
-
309
-
310
-
311
-
312
-
313
-
314
-
315
-
316
-
317
-
318
-
319
-
320
-
321
-
322
 |
 |

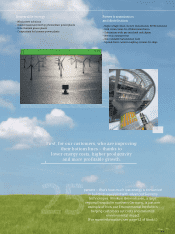
Industry
Our Industry Sector offers a complete spectrum of products, services and solutions for the efficient use
of resources and energy and improvements of productivity in industry and infrastructure. Its integrated
technologies and holistic solutions address primarily industrial customers, such as process and manu-
facturing industries, and infrastructure customers, especially in the areas of transport, buildings and
utilities. The portfolio spans industry automation and drives products and services, building, lighting
and mobility solutions and services, and system integration and solutions for plant businesses.
Energy
Our Energy Sector offers a wide spectrum of products, services and solutions for the generation, trans-
mission and distribution of power, and the extraction, conversion and transport of oil and gas. It primarily
addresses the needs of energy providers, but also serves industrial companies, particularly in the oil
and gas industry.
1 Financial results relating to the Energy Service Division are reflected in the Fossil Power Generation and the Oil & Gas Divisions.
Healthcare
Our Healthcare Sector offers customers a comprehensive portfolio of medical solutions across the
value-added chain – ranging from medical imaging to in-vitro diagnostics to interventional systems and
clinical information technology systems – all from a single source. In addition, the Sector provides tech-
nical maintenance, professional and consulting services, and, together with Siemens Financial Services,
financing to assist customers in purchasing the Sector’s products.
Industry Automation
Drive Technologies
Building Technologies
OSRAM
Industry Solutions
Mobility
Revenue € 35.043 billion
Profit € 2.701 billion
Fossil Power Generation1
Renewable Energy
Oil & Gas1
Power Transmission
Power Distribution
Revenue € 25.793 billion
Profit € 3.315 billion
Imaging & IT
Workflow & Solutions
Diagnostics
Revenue € 11.927 billion
Profit € 1.450 billion
Cross-Sector Businesses
Siemens IT Solutions and Services designs, builds and operates both discrete and large scale information
and communications systems and offers comprehensive information technology and communications
solutions from a single source both to third parties and to other Siemens entities. Siemens Financial
Services is an international provider of financial solutions in the business-to-business area. SFS supports
Siemens as well as third parties in the three industry areas of industry, energy, and healthcare. SFS
finances infrastructure, equipment and working capital and supports and advises Siemens concerning
financial risk and investment management. By integrating financing expertise and industrial know-
how, SFS creates value for its customers and helps them strengthen their competitiveness.
Siemens IT Solutions
and Services
Siemens Financial Services
Revenue € 4.686 billion
Profit € 90 million
Equity Investments
In general, Equity Investments comprises equity stakes held by Siemens that are accounted for by the
equity method, at cost or as current available-for-sale financial assets and which are not allocated to a
Sector, a Cross-Sector Business, Siemens Real Estate (SRE), Pensions or Corporate Treasury for strategic
reasons. Major components of Equity Investments include our 50% stakes in Nokia Siemens Networks B.V.
(NSN) and BSH Bosch und Siemens Hausgeräte GmbH (BSH), our 49% stake in Enterprise Networks
Holdings B.V. (EN), and our 49% stake in Krauss-Maffei Wegmann GmbH & Co. KG.
Major
investments
Nokia Siemens Networks
BSH Bosch und Siemens
Hausgeräte GmbH
Profit € (1.851) billion
Segment information
Profit € 304 million
Total
assets € 11.704 billion