Siemens 2009 Annual Report Download - page 176
Download and view the complete annual report
Please find page 176 of the 2009 Siemens annual report below. You can navigate through the pages in the report by either clicking on the pages listed below, or by using the keyword search tool below to find specific information within the annual report.-
 1
1 -
2
-
3
-
4
-
5
-
6
-
7
-
8
-
9
-
10
-
11
-
12
-
13
-
14
-
15
-
16
-
17
-
18
-
19
-
20
-
21
-
22
-
23
-
24
-
25
-
26
-
27
-
28
-
29
-
30
-
31
-
32
-
33
-
34
-
35
-
36
-
37
-
38
-
39
-
40
-
41
-
42
-
43
-
44
-
45
-
46
-
47
-
48
-
49
-
50
-
51
-
52
-
53
-
54
-
55
-
56
-
57
-
58
-
59
-
60
-
61
-
62
-
63
-
64
-
65
-
66
-
67
-
68
-
69
-
70
-
71
-
72
-
73
-
74
-
75
-
76
-
77
-
78
-
79
-
80
-
81
-
82
-
83
-
84
-
85
-
86
-
87
-
88
-
89
-
90
-
91
-
92
-
93
-
94
-
95
-
96
-
97
-
98
-
99
-
100
-
101
-
102
-
103
-
104
-
105
-
106
-
107
-
108
-
109
-
110
-
111
-
112
-
113
-
114
-
115
-
116
-
117
-
118
-
119
-
120
-
121
-
122
-
123
-
124
-
125
-
126
-
127
-
128
-
129
-
130
-
131
-
132
-
133
-
134
-
135
-
136
-
137
-
138
-
139
-
140
-
141
-
142
-
143
-
144
-
145
-
146
-
147
-
148
-
149
-
150
-
151
-
152
-
153
-
154
-
155
-
156
-
157
-
158
-
159
-
160
-
161
-
162
-
163
-
164
-
165
-
 166
166 -
 167
167 -
 168
168 -
 169
169 -
 170
170 -
 171
171 -
 172
172 -
 173
173 -
 174
174 -
 175
175 -
 176
176 -
 177
177 -
 178
178 -
 179
179 -
 180
180 -
 181
181 -
 182
182 -
 183
183 -
 184
184 -
 185
185 -
 186
186 -
187
-
188
-
189
-
190
-
191
-
192
-
193
-
194
-
195
-
196
-
197
-
198
-
199
-
200
-
201
-
202
-
203
-
204
-
205
-
206
-
207
-
208
-
209
-
210
-
211
-
212
-
213
-
214
-
215
-
216
-
217
-
218
-
219
-
220
-
221
-
222
-
223
-
224
-
225
-
226
-
227
-
228
-
229
-
230
-
231
-
232
-
233
-
234
-
235
-
236
-
237
-
238
-
239
-
240
-
241
-
242
-
243
-
244
-
245
-
246
-
247
-
248
-
249
-
250
-
251
-
252
-
253
-
254
-
255
-
256
-
257
-
258
-
259
-
260
-
261
-
262
-
263
-
264
-
265
-
266
-
267
-
268
-
269
-
270
-
271
-
272
-
273
-
274
-
275
-
276
-
277
-
278
-
279
-
280
-
281
-
282
-
283
-
284
-
285
-
286
-
287
-
288
-
289
-
290
-
291
-
292
-
293
-
294
-
295
-
296
-
297
-
298
-
299
-
300
-
301
-
302
-
303
-
304
-
305
-
306
-
307
-
308
-
309
-
310
-
311
-
312
-
313
-
314
-
315
-
316
-
317
-
318
-
319
-
320
-
321
-
322
 |
 |

88
Reports Supervisory Board /
Managing Board Corporate Governance Management’s discussion and analysis Consolidated Financial Statements
44 Business and operating environment 63 Fiscal 2009 – Financial summary 66 Results of operations 84 Financial position
tors for fiscal 2009 cash flow from operating activities include
cash inflows related to trade receivables. Industry decreased
trade receivables compared to an increase in the prior year.
Energy posted lower additions to trade receivables and re-
duced its build-up of inventories compared to the fiscal 2008,
and both Industry and Healthcare reduced inventory levels
year-over-year.
Discontinued operations improved to net cash used of €145
million in fiscal 2009. For comparison, net cash used of
€657 million in the prior year included a payment of a €201 mil-
lion fine related to former Com activities.
Investing activities in continuing and discontinued opera-
tions used net cash of €3.625 billion in fiscal 2009, compared
to net cash used of €407 million in fiscal 2008. Within the total,
net cash used in investing activities for continuing operations
amounted to €3.431 billion in the current year and €9.989 bil-
lion in the prior year. Within continuing activities proceeds
from sales of investments, intangibles and property, plant and
equipment provided net cash of €1.221 billion due mainly to
the sale of our residential real estate holdings and the sale of
our 50% stake of FSC to Fujitsu Limited. Purchases of invest-
ments in the current year included cash outflows of €750 mil-
lion related to two drawdown requests by NSN in relation to a
Shareholder Loan Agreement between NSN and us. Reduced
SFS financing activities in fiscal 2009 resulted in lower cash
outflows relating to receivables from financing activities com-
pared to the prior year. Cash outflows for acquisitions in fiscal
2008 related primarily to the acquisition of Dade Behring at
Healthcare for €4.4 billion (net of €69 million cash acquired).
Discontinued operations in fiscal 2009 used net cash of
€194 million. This total includes cash outflows related to the
divestment of our mobile devices business in fiscal 2005, in-
cluding €0.3 billion related to a settlement with the insolvency
administrator of BenQ Mobile GmbH & Co. OHG as well as cash
outflows related to the settlement of legal matters. Cash out-
flows from discontinued operations were partially offset by
cash inflows due to a settlement between The Gores Group and
us in fiscal 2009 regarding pending requirements for purchase
price adjustment and further mutual obligations in relation to
the disposal of the former SEN business. A year earlier, discon-
tinued operations provided €9.582 billion in net cash, due pri-
marily to proceeds of €11.4 billion from the sale of SV and net
cash used of €1.1 billion relating to the transfer of SEN activi-
ties into EN.
Free cash flow from continuing and discontinued operations
amounted to €3.641 million in fiscal 2009, compared to
€4.903 billion in the prior year. Within the total, Free cash flow
from continuing operations in the current year amounted to
€3.786 billion, compared to €5.739 billion a year earlier. The
change year-over-year was due primarily to the decrease in net
cash provided by operating activities discussed above. Cash
used for capital expenditures within continuing operations
was €2.923 billion in fiscal 2009, down from €3.542 billion a
year earlier. For further information about our capital expendi-
tures please refer to “ – Capital resources and requirements”.
The cash conversion rate for continuing operations, calculated
as Free cash flow from continuing operations divided by In-
come from continuing operations, was 1.54 for fiscal 2009
compared to 3.09 in fiscal 2008.
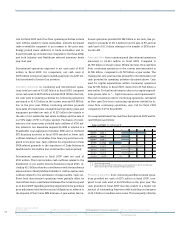
On a sequential basis Free cash flow during fiscal 2009 and fis-
cal 2008 were as follows:
Financing activities from continuing and discontinued opera-
tions provided net cash of €375 million in fiscal 2009, com-
pared to net cash used of €6.129 billion in the prior year. The
cash provided in fiscal 2009 was due mainly to a higher net
amount of outstanding long-term debt including our issuance
of €4.0 billion in medium-term notes. This was partly offset by
Free cash flow (in millions of €)
Q4 09 3,158
Q3 09 1,064
Q2 09 1,138
Q1 092(1,574)
Q4 08 2,786
Q3 08 1,547
Q2 08 1,623
Q1 08 (217)
1 Continuing operations
2 Free cash flow includes €1,008 millions paid to authorities in the US and Germany
related to charges for the resolution of legal proceedings.
B25G014_E