Siemens 2009 Annual Report Download - page 184
Download and view the complete annual report
Please find page 184 of the 2009 Siemens annual report below. You can navigate through the pages in the report by either clicking on the pages listed below, or by using the keyword search tool below to find specific information within the annual report.-
 1
1 -
2
-
3
-
4
-
5
-
6
-
7
-
8
-
9
-
10
-
11
-
12
-
13
-
14
-
15
-
16
-
17
-
18
-
19
-
20
-
21
-
22
-
23
-
24
-
25
-
26
-
27
-
28
-
29
-
30
-
31
-
32
-
33
-
34
-
35
-
36
-
37
-
38
-
39
-
40
-
41
-
42
-
43
-
44
-
45
-
46
-
47
-
48
-
49
-
50
-
51
-
52
-
53
-
54
-
55
-
56
-
57
-
58
-
59
-
60
-
61
-
62
-
63
-
64
-
65
-
66
-
67
-
68
-
69
-
70
-
71
-
72
-
73
-
74
-
75
-
76
-
77
-
78
-
79
-
80
-
81
-
82
-
83
-
84
-
85
-
86
-
87
-
88
-
89
-
90
-
91
-
92
-
93
-
94
-
95
-
96
-
97
-
98
-
99
-
100
-
101
-
102
-
103
-
104
-
105
-
106
-
107
-
108
-
109
-
110
-
111
-
112
-
113
-
114
-
115
-
116
-
117
-
118
-
119
-
120
-
121
-
122
-
123
-
124
-
125
-
126
-
127
-
128
-
129
-
130
-
131
-
132
-
133
-
134
-
135
-
136
-
137
-
138
-
139
-
140
-
141
-
142
-
143
-
144
-
145
-
146
-
147
-
148
-
149
-
150
-
151
-
152
-
153
-
154
-
155
-
156
-
157
-
158
-
159
-
160
-
161
-
162
-
163
-
164
-
165
-
166
-
167
-
168
-
169
-
170
-
171
-
172
-
173
-
 174
174 -
 175
175 -
 176
176 -
 177
177 -
 178
178 -
 179
179 -
 180
180 -
 181
181 -
 182
182 -
 183
183 -
 184
184 -
 185
185 -
 186
186 -
 187
187 -
 188
188 -
 189
189 -
 190
190 -
 191
191 -
 192
192 -
 193
193 -
 194
194 -
195
-
196
-
197
-
198
-
199
-
200
-
201
-
202
-
203
-
204
-
205
-
206
-
207
-
208
-
209
-
210
-
211
-
212
-
213
-
214
-
215
-
216
-
217
-
218
-
219
-
220
-
221
-
222
-
223
-
224
-
225
-
226
-
227
-
228
-
229
-
230
-
231
-
232
-
233
-
234
-
235
-
236
-
237
-
238
-
239
-
240
-
241
-
242
-
243
-
244
-
245
-
246
-
247
-
248
-
249
-
250
-
251
-
252
-
253
-
254
-
255
-
256
-
257
-
258
-
259
-
260
-
261
-
262
-
263
-
264
-
265
-
266
-
267
-
268
-
269
-
270
-
271
-
272
-
273
-
274
-
275
-
276
-
277
-
278
-
279
-
280
-
281
-
282
-
283
-
284
-
285
-
286
-
287
-
288
-
289
-
290
-
291
-
292
-
293
-
294
-
295
-
296
-
297
-
298
-
299
-
300
-
301
-
302
-
303
-
304
-
305
-
306
-
307
-
308
-
309
-
310
-
311
-
312
-
313
-
314
-
315
-
316
-
317
-
318
-
319
-
320
-
321
-
322
 |
 |

96
Reports Supervisory Board /
Managing Board Corporate Governance Management’s discussion and analysis Consolidated Financial Statements
44 Business and operating environment 63 Fiscal 2009 – Financial summary 66 Results of operations 84 Financial position
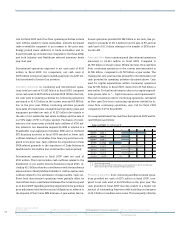
The table below shows current and long-term liabilities at the
respective balance sheet dates:
Short-term debt and current maturities of long-term debt to-
taled €698 million at the end of fiscal 2009, a decrease of €1.121
billion from the prior year-end. This decrease mainly results
from the repayment of a €500 million floating rate extendible
note and US$750 million floating rate notes in fiscal 2009, due
to maturity of these notes.
Trade payables decreased to €7.593 billion, down €1.267 billion
from the end of fiscal 2008. The decline was driven by lower
trade payables in all three Sectors, led by Industry.
The decrease of €974 million in current provisions is due
mainly to the payment of the €1.008 billion related to charges
for the resolution of legal proceeding mentioned earlier.
Other current liabilities decreased by €1.333 billion compared
to the prior year-end, including lower billings in excess of cost
in Industry and Energy. Due to the progress in our global SG&A
program, accruals for severance payments under this program
also declined year-over-year.
The decline in liabilities associated with assets classified as
held for disposal was driven primarily by the divestment of
SHC mentioned above.
Compared to the end of fiscal 2008, long-term debt increased
by €4.680 billion to €18.940 billion at the end of the current
year, mainly due to the above-mentioned issuance of €4.0 bil-
lion in medium-term notes under our EMTN program and the
effect of fair value hedge accounting. Further information
with respect to short- and long-term debt is also provided un-
der “Financial position – Capital resources and requirements”
as well as in the “Notes to Consolidated Financial Statements.”
Shareholders’ equity and total assets were as follows:
Total equity attributable to shareholders of Siemens AG de-
creased €128 million year-over-year, to €26.646 billion at the
end of fiscal 2009. Within this change, Net income attributable
to shareholders of Siemens AG of €2.292 billion was offset by
dividend payments of €1.380 billion and actuarial losses on
pension plans and similar commitments of €1.248 billion,
among other factors.
As both Total assets and Total equity attributable to sharehold-
ers of Siemens AG were widely stable year-over-year, our
equity ratio remained at 28%.
For additional information on our net assets position, see
“Notes to Consolidated Financial Statements.”
(in millions of €)
September 30,
2009 2008
Short-term debt and current maturities
of long-term debt 698 1,819
Trade payables 7,593 8,860
Other current financial liabilities 2,119 2,427
Current provisions 4,191 5,165
Income tax payables 1,936 1,970
Other current liabilities 20,311 21,644
Liabilities associated with assets classified
as held for disposal 157 566
Total current liabilities 37,005 42,451
Long-term debt 18,940 14,260
Pension plans and similar commitments 5,938 4,361
Deferred tax liabilities 776 726
Provisions 2,771 2,533
Other financial liabilities 187 376
Other liabilities 2,022 2,376
Total long-term liabilities 30,634 24,632
B25T032_E
(in millions of €)
September 30,
2009 2008
Total equity attributable to shareholders
of Siemens AG 26,646 26,774
Equity ratio 28% 28%
Minority interest 641 606
Total assets 94,926 94,463
B25T033_E