Siemens 2009 Annual Report Download - page 213
Download and view the complete annual report
Please find page 213 of the 2009 Siemens annual report below. You can navigate through the pages in the report by either clicking on the pages listed below, or by using the keyword search tool below to find specific information within the annual report.-
 1
1 -
2
-
3
-
4
-
5
-
6
-
7
-
8
-
9
-
10
-
11
-
12
-
13
-
14
-
15
-
16
-
17
-
18
-
19
-
20
-
21
-
22
-
23
-
24
-
25
-
26
-
27
-
28
-
29
-
30
-
31
-
32
-
33
-
34
-
35
-
36
-
37
-
38
-
39
-
40
-
41
-
42
-
43
-
44
-
45
-
46
-
47
-
48
-
49
-
50
-
51
-
52
-
53
-
54
-
55
-
56
-
57
-
58
-
59
-
60
-
61
-
62
-
63
-
64
-
65
-
66
-
67
-
68
-
69
-
70
-
71
-
72
-
73
-
74
-
75
-
76
-
77
-
78
-
79
-
80
-
81
-
82
-
83
-
84
-
85
-
86
-
87
-
88
-
89
-
90
-
91
-
92
-
93
-
94
-
95
-
96
-
97
-
98
-
99
-
100
-
101
-
102
-
103
-
104
-
105
-
106
-
107
-
108
-
109
-
110
-
111
-
112
-
113
-
114
-
115
-
116
-
117
-
118
-
119
-
120
-
121
-
122
-
123
-
124
-
125
-
126
-
127
-
128
-
129
-
130
-
131
-
132
-
133
-
134
-
135
-
136
-
137
-
138
-
139
-
140
-
141
-
142
-
143
-
144
-
145
-
146
-
147
-
148
-
149
-
150
-
151
-
152
-
153
-
154
-
155
-
156
-
157
-
158
-
159
-
160
-
161
-
162
-
163
-
164
-
165
-
166
-
167
-
168
-
169
-
170
-
171
-
172
-
173
-
174
-
175
-
176
-
177
-
178
-
179
-
180
-
181
-
182
-
183
-
184
-
185
-
186
-
187
-
188
-
189
-
190
-
191
-
192
-
193
-
194
-
195
-
196
-
197
-
198
-
199
-
200
-
201
-
202
-
 203
203 -
 204
204 -
 205
205 -
 206
206 -
 207
207 -
 208
208 -
 209
209 -
 210
210 -
 211
211 -
 212
212 -
 213
213 -
 214
214 -
 215
215 -
 216
216 -
 217
217 -
 218
218 -
 219
219 -
 220
220 -
 221
221 -
 222
222 -
 223
223 -
224
-
225
-
226
-
227
-
228
-
229
-
230
-
231
-
232
-
233
-
234
-
235
-
236
-
237
-
238
-
239
-
240
-
241
-
242
-
243
-
244
-
245
-
246
-
247
-
248
-
249
-
250
-
251
-
252
-
253
-
254
-
255
-
256
-
257
-
258
-
259
-
260
-
261
-
262
-
263
-
264
-
265
-
266
-
267
-
268
-
269
-
270
-
271
-
272
-
273
-
274
-
275
-
276
-
277
-
278
-
279
-
280
-
281
-
282
-
283
-
284
-
285
-
286
-
287
-
288
-
289
-
290
-
291
-
292
-
293
-
294
-
295
-
296
-
297
-
298
-
299
-
300
-
301
-
302
-
303
-
304
-
305
-
306
-
307
-
308
-
309
-
310
-
311
-
312
-
313
-
314
-
315
-
316
-
317
-
318
-
319
-
320
-
321
-
322
 |
 |

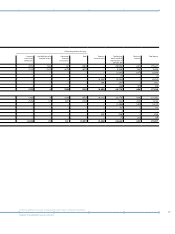
Consolidated Statements of Cash Flow
For the fi scal years ended September 30, 2009 and 2008
Fiscal years ended September ,
(in millions of €) Note
Cash fl ows from operating activities
Net income 2,497 5,886
Adjustments to reconcile net income to cash provided
Amortization, depreciation and impairments 2,924 3,213
Income taxes 1,492 831
Interest (income) expense, net (158) (75)
(Gains) losses on sales and disposals of businesses, intangibles and property, plant and equipment, net (434) (5,092)
(Gains) on sales of investments, net (351) (35)
(Gains) losses on sales and impairments of current available-for-sale fi nancial assets, net 11 (5)
(Income) losses from investments 1,921 (328)
Other non-cash (income) expenses 354 383
Change in current assets and liabilities
(Increase) decrease in inventories (62) (1,631)
(Increase) decrease in trade and other receivables 1,104 (1,088)
(Increase) decrease in other current assets 232 167
Increase (decrease) in trade payables (1,070) 719
Increase (decrease) in current provisions (669) 1,414
Increase (decrease) in other current liabilities (737) 4,417
Change in other assets and liabilities (164) 200
Income taxes paid (1,536) (1,564)
Dividends received 441 337
Interest received 769 875
Net cash provided by (used in) operating activities – continuing and discontinued operations 6,564 8,624
Net cash provided by (used in) operating activities – continuing operations 6,709 9,281
Cash fl ows from investing activities
Additions to intangible assets and property, plant and equipment (2,923) (3,721)
Acquisitions, net of cash acquired (208) (5,407)
Purchases of investments
(972) (151)
Purchases of current available-for-sale fi nancial assets (52) (16)
(Increase) decrease in receivables from fi nancing activities (495) (2,445)
Proceeds from sales of investments, intangibles and property, plant and equipment
1,224 803
Proceeds and (payments) from disposals of businesses (234) 10,481
Proceeds from sales of current available-for-sale fi nancial assets 35 49
Net cash provided by (used in) investing activities – continuing and discontinued operations (3,625) (407)
Net cash provided by (used in) investing activities – continuing operations (3,431) (9,989)
Cash fl ows from fi nancing activities
Purchase of common stock – (4,350)
Proceeds from re-issuance of treasury stock 134 248
Proceeds from issuance of long-term debt 3,973 5,728
Repayment of long-term debt (including current maturities of long-term debt) (1,076) (691)
Change in short-term debt and other fi nancing activities (356) (4,635)
Interest paid (759) (829)
Dividends paid (1,380) (1,462)
Dividends paid to minority shareholders (161) (138)
Net cash provided by (used in) fi nancing activities – continuing and discontinued operations 375 (6,129)
Net cash provided by (used in) fi nancing activities – continuing operations 36 3,730
Effect of exchange rates on cash and cash equivalents (39) (99)
Net increase (decrease) in cash and cash equivalents 3,275 1,989
Cash and cash equivalents at beginning of period 6,929 4,940
Cash and cash equivalents at end of period 10,204 6,929
Less: Cash and cash equivalents of assets classifi ed as held for disposal
and discontinued operations at end of period 45 36
Cash and cash equivalents at end of period (Consolidated Balance Sheets) 10,159 6,893
1 Investments include equity instruments either classifi ed as non-current available-for-sale fi nancial assets, accounted for using the equity method or classifi ed as held for disposal.
Purchase of Investments includes certain loans to Investments accounted for using the equity method.
The accompanying Notes are an integral part of these Consolidated Financial Statements.
B26T004_E