Siemens 2009 Annual Report Download - page 154
Download and view the complete annual report
Please find page 154 of the 2009 Siemens annual report below. You can navigate through the pages in the report by either clicking on the pages listed below, or by using the keyword search tool below to find specific information within the annual report.-
 1
1 -
2
-
3
-
4
-
5
-
6
-
7
-
8
-
9
-
10
-
11
-
12
-
13
-
14
-
15
-
16
-
17
-
18
-
19
-
20
-
21
-
22
-
23
-
24
-
25
-
26
-
27
-
28
-
29
-
30
-
31
-
32
-
33
-
34
-
35
-
36
-
37
-
38
-
39
-
40
-
41
-
42
-
43
-
44
-
45
-
46
-
47
-
48
-
49
-
50
-
51
-
52
-
53
-
54
-
55
-
56
-
57
-
58
-
59
-
60
-
61
-
62
-
63
-
64
-
65
-
66
-
67
-
68
-
69
-
70
-
71
-
72
-
73
-
74
-
75
-
76
-
77
-
78
-
79
-
80
-
81
-
82
-
83
-
84
-
85
-
86
-
87
-
88
-
89
-
90
-
91
-
92
-
93
-
94
-
95
-
96
-
97
-
98
-
99
-
100
-
101
-
102
-
103
-
104
-
105
-
106
-
107
-
108
-
109
-
110
-
111
-
112
-
113
-
114
-
115
-
116
-
117
-
118
-
119
-
120
-
121
-
122
-
123
-
124
-
125
-
126
-
127
-
128
-
129
-
130
-
131
-
132
-
133
-
134
-
135
-
136
-
137
-
138
-
139
-
140
-
141
-
142
-
143
-
 144
144 -
 145
145 -
 146
146 -
 147
147 -
 148
148 -
 149
149 -
 150
150 -
 151
151 -
 152
152 -
 153
153 -
 154
154 -
 155
155 -
 156
156 -
 157
157 -
 158
158 -
 159
159 -
 160
160 -
 161
161 -
 162
162 -
 163
163 -
 164
164 -
165
-
166
-
167
-
168
-
169
-
170
-
171
-
172
-
173
-
174
-
175
-
176
-
177
-
178
-
179
-
180
-
181
-
182
-
183
-
184
-
185
-
186
-
187
-
188
-
189
-
190
-
191
-
192
-
193
-
194
-
195
-
196
-
197
-
198
-
199
-
200
-
201
-
202
-
203
-
204
-
205
-
206
-
207
-
208
-
209
-
210
-
211
-
212
-
213
-
214
-
215
-
216
-
217
-
218
-
219
-
220
-
221
-
222
-
223
-
224
-
225
-
226
-
227
-
228
-
229
-
230
-
231
-
232
-
233
-
234
-
235
-
236
-
237
-
238
-
239
-
240
-
241
-
242
-
243
-
244
-
245
-
246
-
247
-
248
-
249
-
250
-
251
-
252
-
253
-
254
-
255
-
256
-
257
-
258
-
259
-
260
-
261
-
262
-
263
-
264
-
265
-
266
-
267
-
268
-
269
-
270
-
271
-
272
-
273
-
274
-
275
-
276
-
277
-
278
-
279
-
280
-
281
-
282
-
283
-
284
-
285
-
286
-
287
-
288
-
289
-
290
-
291
-
292
-
293
-
294
-
295
-
296
-
297
-
298
-
299
-
300
-
301
-
302
-
303
-
304
-
305
-
306
-
307
-
308
-
309
-
310
-
311
-
312
-
313
-
314
-
315
-
316
-
317
-
318
-
319
-
320
-
321
-
322
 |
 |
66
Reports Supervisory Board /
Managing Board Corporate Governance Management’s discussion and analysis Consolidated Financial Statements
44 Business and operating environment 63 Fiscal 2009 – Financial summary 66 Results of operations 84 Financial position
Results of operations
RESULTS OF SIEMENS
The following discussion presents selected information for
Siemens for the fiscal year ended September 30, 2009:
Order situation and revenue
In fiscal 2009, revenue declined 1% year-over-year, to €76.651
billion, while orders came in at €78.991 billion, down 16% from
the prior-year period. This resulted in a book-to-bill ratio of
1.03. On an organic basis, excluding the net effect of currency
translation and portfolio transactions, revenue came in level
with the prior year, while orders decreased 14%. Within the
full-year trend, we saw order intake declining in the second
half of fiscal 2009 compared to the first half due to the trends
in the global macroeconomic and financing environment de-
scribed in the section “Business and operating environment –
Economic environment,” while revenue development was sig-
nificantly stabilized by our strong order backlog. Accordingly,
our book-to-bill ratio fell from 1.12 in the first six months to
0.94 in the second half of fiscal 2009. The total order backlog
for our three Sectors was €81.2 billion as of September 30,
2009, slightly down from €83.1 billion a year earlier, due pri-
marily to negative currency translation effects. Out of the cur-
rent backlog, orders of €36 billion are expected to be converted
into revenue during fiscal 2010, orders of €17 billion during
2011, and the remainder in the periods there after.
Orders related to external customers decreased 16% in fiscal
2009, driven by sharp declines in Industry and to a lesser ex-
tent in Energy. In the Industry Sector – our largest Sector – or-
der intake decreased more than 20% compared to the high
level of the prior year. All Industry Divisions reported lower or-
ders, led by declines at Drive Technologies, Industry Solutions
and Industry Automation. Due in part to customer postpone-
ments of potential new projects, the Energy Sector saw orders
fall 10% from the high level of fiscal 2008, driven primarily by
lower demand at Oil & Gas, Power Transmission and Fossil
Power Generation. In contrast, order intake increased at Re-
newable Energy, as the Division continued to win large con-
tracts for offshore wind-farm projects. Orders rose modestly in
Healthcare, benefiting from positive currency translation ef-
fects from the U.S. In addition, orders at Other Operations de-
clined significantly in the current period due primarily to sub-
stantial dispositions and other streamlining actions.
In the region Europe, C.I.S., Africa, Middle East – our largest
reporting region – orders declined 17%, including sharply
lower order intake in Industry on decreases in all Divisions. In
most cases the declines were driven by macroeconomic condi-
tions. Lower order intake at Mobility in the region was due to
lower volume from major orders compared to the prior fiscal
year, which included Siemens’ largest-ever rolling stock order,
a €1.4 billion contract for more than 300 trains from the Bel-
gian state railway system. Higher demand at Renewable En-
ergy, driven by a number of large orders in the current period,
limited the drop in order intake in the Energy Sector in Europe,
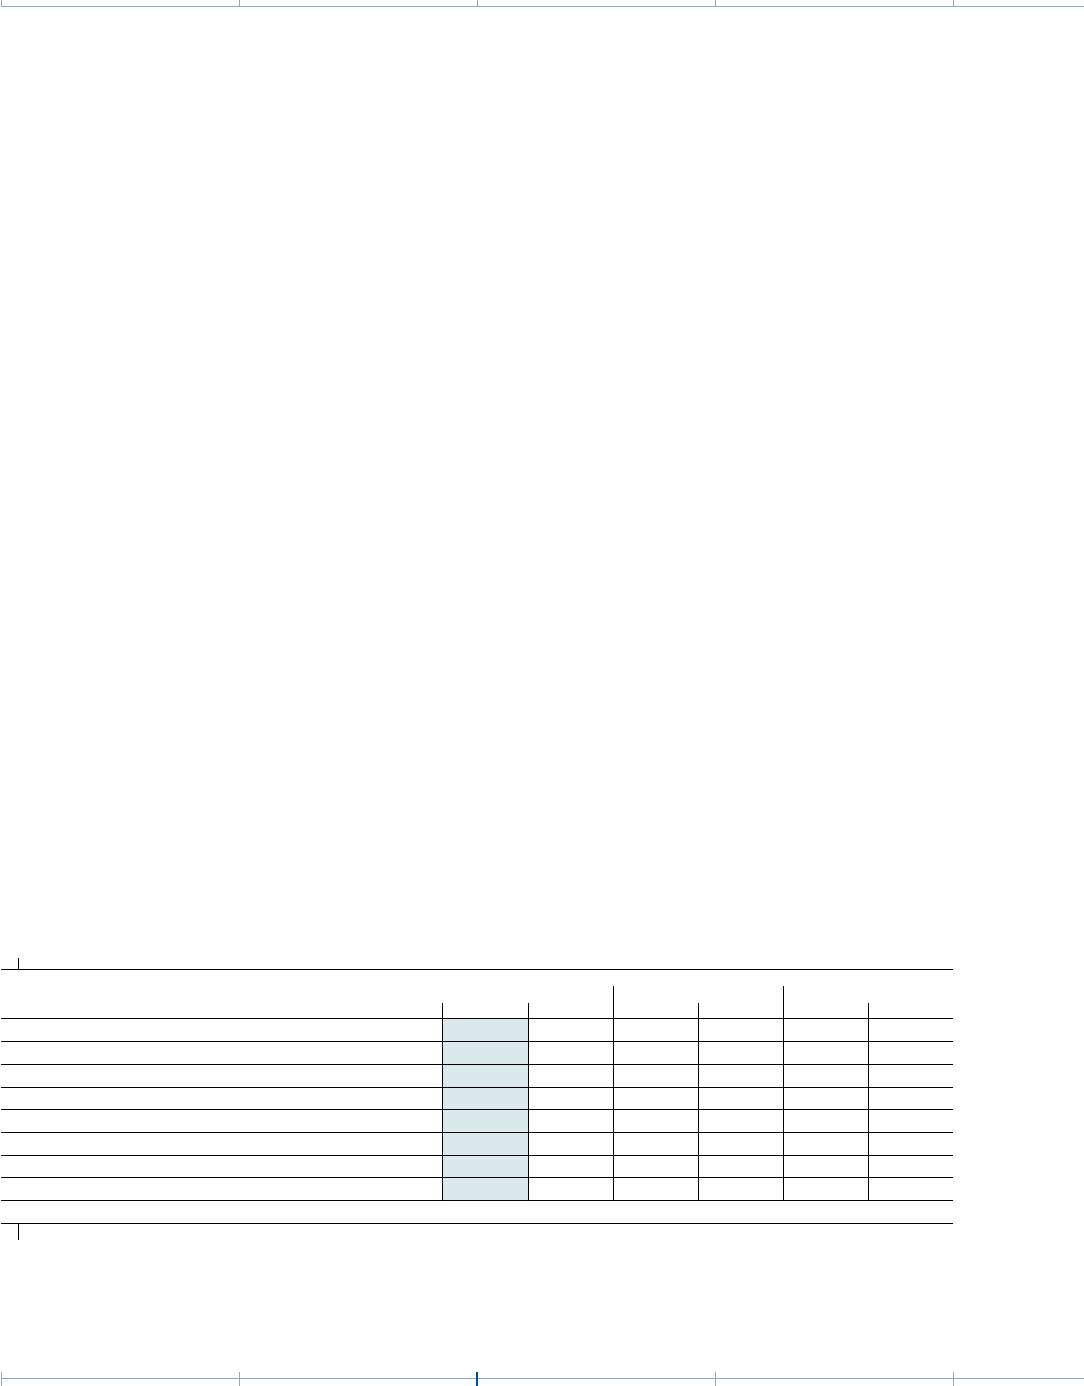
New Orders (location of customer)
Year ended September , % Change vs. previous year therein
(in millions of €) Actual Adjusted Currency Portfolio
Europe, C.I.S., Africa, Middle East 45,696 55,229 (17)% (13)% (2)% (2)%
therein Germany 12,307 14,434 (15)% (13)% 0% (2)%
Americas 19,935 24,010 (17)% (21)% 5% (1)%
therein U.S. 14,691 17,437 (16)% (23)% 8% (1)%
Asia, Australia 13,360 14,256 (6)% (9)% 3% 0%
therein China 5,525 5,446 1% (7)% 8% 0%
therein India 2,309 2,268 2% 7% (5)% 0%
Siemens 78,991 93,495 (16)% (14)% 0% (2)%
1 Excluding currency translation and portfolio effects. 2 Commonwealth of Independent States.
B25T003_E