Siemens 2009 Annual Report Download - page 289
Download and view the complete annual report
Please find page 289 of the 2009 Siemens annual report below. You can navigate through the pages in the report by either clicking on the pages listed below, or by using the keyword search tool below to find specific information within the annual report.-
 1
1 -
2
-
3
-
4
-
5
-
6
-
7
-
8
-
9
-
10
-
11
-
12
-
13
-
14
-
15
-
16
-
17
-
18
-
19
-
20
-
21
-
22
-
23
-
24
-
25
-
26
-
27
-
28
-
29
-
30
-
31
-
32
-
33
-
34
-
35
-
36
-
37
-
38
-
39
-
40
-
41
-
42
-
43
-
44
-
45
-
46
-
47
-
48
-
49
-
50
-
51
-
52
-
53
-
54
-
55
-
56
-
57
-
58
-
59
-
60
-
61
-
62
-
63
-
64
-
65
-
66
-
67
-
68
-
69
-
70
-
71
-
72
-
73
-
74
-
75
-
76
-
77
-
78
-
79
-
80
-
81
-
82
-
83
-
84
-
85
-
86
-
87
-
88
-
89
-
90
-
91
-
92
-
93
-
94
-
95
-
96
-
97
-
98
-
99
-
100
-
101
-
102
-
103
-
104
-
105
-
106
-
107
-
108
-
109
-
110
-
111
-
112
-
113
-
114
-
115
-
116
-
117
-
118
-
119
-
120
-
121
-
122
-
123
-
124
-
125
-
126
-
127
-
128
-
129
-
130
-
131
-
132
-
133
-
134
-
135
-
136
-
137
-
138
-
139
-
140
-
141
-
142
-
143
-
144
-
145
-
146
-
147
-
148
-
149
-
150
-
151
-
152
-
153
-
154
-
155
-
156
-
157
-
158
-
159
-
160
-
161
-
162
-
163
-
164
-
165
-
166
-
167
-
168
-
169
-
170
-
171
-
172
-
173
-
174
-
175
-
176
-
177
-
178
-
179
-
180
-
181
-
182
-
183
-
184
-
185
-
186
-
187
-
188
-
189
-
190
-
191
-
192
-
193
-
194
-
195
-
196
-
197
-
198
-
199
-
200
-
201
-
202
-
203
-
204
-
205
-
206
-
207
-
208
-
209
-
210
-
211
-
212
-
213
-
214
-
215
-
216
-
217
-
218
-
219
-
220
-
221
-
222
-
223
-
224
-
225
-
226
-
227
-
228
-
229
-
230
-
231
-
232
-
233
-
234
-
235
-
236
-
237
-
238
-
239
-
240
-
241
-
242
-
243
-
244
-
245
-
246
-
247
-
248
-
249
-
250
-
251
-
252
-
253
-
254
-
255
-
256
-
257
-
258
-
259
-
260
-
261
-
262
-
263
-
264
-
265
-
266
-
267
-
268
-
269
-
270
-
271
-
272
-
273
-
274
-
275
-
276
-
277
-
278
-
 279
279 -
 280
280 -
 281
281 -
 282
282 -
 283
283 -
 284
284 -
 285
285 -
 286
286 -
 287
287 -
 288
288 -
 289
289 -
 290
290 -
 291
291 -
 292
292 -
 293
293 -
 294
294 -
 295
295 -
 296
296 -
 297
297 -
 298
298 -
 299
299 -
300
-
301
-
302
-
303
-
304
-
305
-
306
-
307
-
308
-
309
-
310
-
311
-
312
-
313
-
314
-
315
-
316
-
317
-
318
-
319
-
320
-
321
-
322
 |
 |
Managing Board statements, Independent auditors’ report, Additional information
Notes to Consolidated Financial Statements
(in millions of €, except where otherwise
stated and per share amounts)
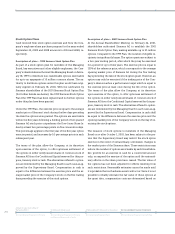
The following table summarizes information on stock options
outstanding at September 30, 2009 and 2008:
the current intrinsic value of the option until the date at which
the number of shares to which a Board member is entitled to
and the exercise price are determinable. Upon that date, fair
value will be determined in accordance with the fair value rec-
ognition provisions of IFRS 2, Share-Based Payment, based on
an appropriate fair value option pricing model.
Year ended
September 30, 2009
Year ended
September 30, 2008
Options Weighted
average
exercise
price
Weighted
average
Remaining
Contractual
Term (years)
Aggregate
intrinsic value
in millions
of €
Options Weighted
average
exercise
price
Outstanding, beginning of period 5,097,083 € 73.60 8,606,272 € 72.13
Granted – – – –
Options exercised – – (2,832,839) € 69.91
Options forfeited/expired/settled 2,469,341 € 73.29 (676,350) € 70.30
Outstanding, end of period 2,627,742 € 73.89 0.8 – 5,097,083 € 73.60
Exercisable, end of period 2,627,742 € 73.89 0.8 – 5,097,083 € 73.60
1 As of September 30, 2008, for Options outstanding the weighted average remaining contractual term was 1.1 years; the aggregate intrinsic value amounted to €–.
B27T090_E
The authority to distribute options under the 2001 Siemens
Stock Option Plan expired on December 13, 2006. Accordingly,
no further options will be granted under this plan.
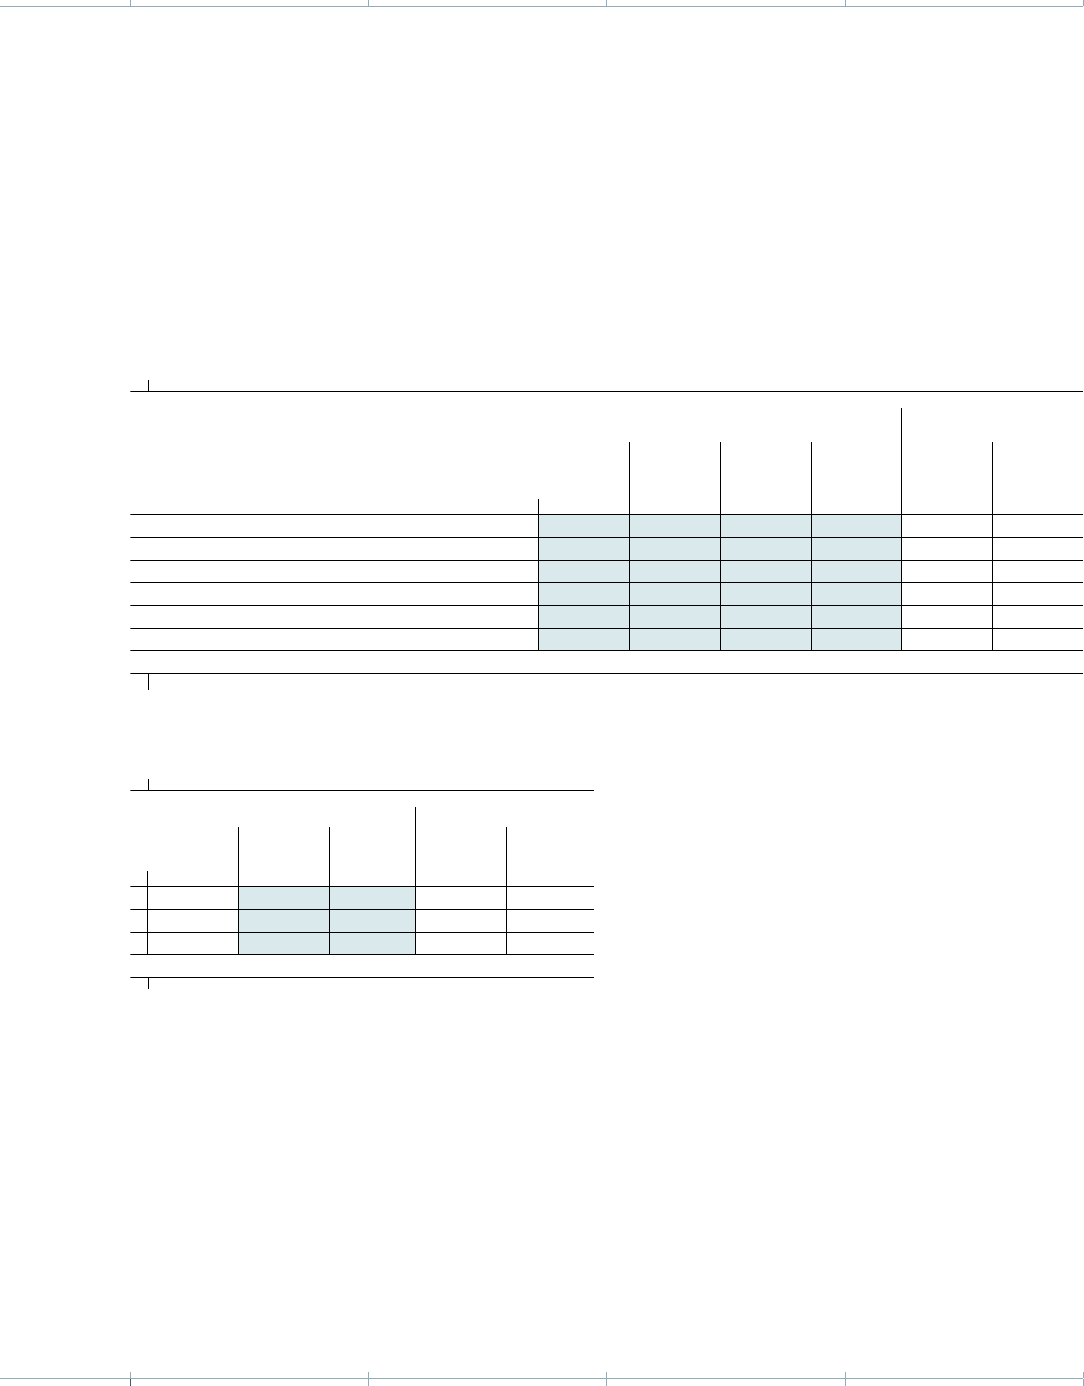
Details on option exercise activity and weighted average exer-
cise prices for the years ended September 30, 2009 and 2008
are as follows:
Fair value information
The Company ’s determination of the fair value of stock option
grants is based on an option pricing model which was devel-
oped for use in estimating the fair values of options that have
no vesting restrictions. Option valuation models require the
input of highly subjective assumptions including the expected
stock price volatility. The fair value per option outstanding as
of September 30, 2009 amounts to €4.06 and €4.54 for grants
made in fiscal 2006 and 2005, respectively.
September 30, 2009 September 30, 2008
Exercise
prices
Number of
Options
outstanding
Weighted
average
remaining
life (years)
Number of
Options
outstanding
Weighted
average
remaining
life (years)
€ 72.54 898,050 0.1 966,950 1.1
€ 73.25 – – 2,289,991 0.1
€ 74.59 1,729,692 1.1 1,840,142 2.1
B27T091_E