Siemens 2009 Annual Report Download - page 167
Download and view the complete annual report
Please find page 167 of the 2009 Siemens annual report below. You can navigate through the pages in the report by either clicking on the pages listed below, or by using the keyword search tool below to find specific information within the annual report.-
 1
1 -
2
-
3
-
4
-
5
-
6
-
7
-
8
-
9
-
10
-
11
-
12
-
13
-
14
-
15
-
16
-
17
-
18
-
19
-
20
-
21
-
22
-
23
-
24
-
25
-
26
-
27
-
28
-
29
-
30
-
31
-
32
-
33
-
34
-
35
-
36
-
37
-
38
-
39
-
40
-
41
-
42
-
43
-
44
-
45
-
46
-
47
-
48
-
49
-
50
-
51
-
52
-
53
-
54
-
55
-
56
-
57
-
58
-
59
-
60
-
61
-
62
-
63
-
64
-
65
-
66
-
67
-
68
-
69
-
70
-
71
-
72
-
73
-
74
-
75
-
76
-
77
-
78
-
79
-
80
-
81
-
82
-
83
-
84
-
85
-
86
-
87
-
88
-
89
-
90
-
91
-
92
-
93
-
94
-
95
-
96
-
97
-
98
-
99
-
100
-
101
-
102
-
103
-
104
-
105
-
106
-
107
-
108
-
109
-
110
-
111
-
112
-
113
-
114
-
115
-
116
-
117
-
118
-
119
-
120
-
121
-
122
-
123
-
124
-
125
-
126
-
127
-
128
-
129
-
130
-
131
-
132
-
133
-
134
-
135
-
136
-
137
-
138
-
139
-
140
-
141
-
142
-
143
-
144
-
145
-
146
-
147
-
148
-
149
-
150
-
151
-
152
-
153
-
154
-
155
-
156
-
 157
157 -
 158
158 -
 159
159 -
 160
160 -
 161
161 -
 162
162 -
 163
163 -
 164
164 -
 165
165 -
 166
166 -
 167
167 -
 168
168 -
 169
169 -
 170
170 -
 171
171 -
 172
172 -
 173
173 -
 174
174 -
 175
175 -
 176
176 -
 177
177 -
178
-
179
-
180
-
181
-
182
-
183
-
184
-
185
-
186
-
187
-
188
-
189
-
190
-
191
-
192
-
193
-
194
-
195
-
196
-
197
-
198
-
199
-
200
-
201
-
202
-
203
-
204
-
205
-
206
-
207
-
208
-
209
-
210
-
211
-
212
-
213
-
214
-
215
-
216
-
217
-
218
-
219
-
220
-
221
-
222
-
223
-
224
-
225
-
226
-
227
-
228
-
229
-
230
-
231
-
232
-
233
-
234
-
235
-
236
-
237
-
238
-
239
-
240
-
241
-
242
-
243
-
244
-
245
-
246
-
247
-
248
-
249
-
250
-
251
-
252
-
253
-
254
-
255
-
256
-
257
-
258
-
259
-
260
-
261
-
262
-
263
-
264
-
265
-
266
-
267
-
268
-
269
-
270
-
271
-
272
-
273
-
274
-
275
-
276
-
277
-
278
-
279
-
280
-
281
-
282
-
283
-
284
-
285
-
286
-
287
-
288
-
289
-
290
-
291
-
292
-
293
-
294
-
295
-
296
-
297
-
298
-
299
-
300
-
301
-
302
-
303
-
304
-
305
-
306
-
307
-
308
-
309
-
310
-
311
-
312
-
313
-
314
-
315
-
316
-
317
-
318
-
319
-
320
-
321
-
322
 |
 |

79
Managing Board statements, Independent auditors’ report, Additional information
95 Net assets position 97 Report on post-balance sheet date events
98 Risk report
108 Information required pursuant to
§315 (4) HGB of the German Commercial
Code and explanatory report
114 Compensation report
114 Report on expected developments
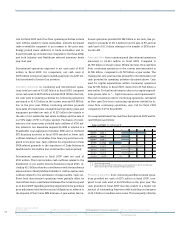
The following table provides further information on the capital
structure of SFS as of September 30, 2009 and 2008:
Both Moody ’s and Standard & Poor’s view SFS as a captive fi-
nance company. These ratings agencies generally recognize
and accept higher levels of debt attributable to captive finance
subsidiaries in determining long-term and short-term credit
ratings.
Siemens Financial Services (SFS)
In fiscal 2009, profit (defined as income before income taxes)
at SFS increased to €304 million compared to €286 million in
the prior year. The current period included higher interest re-
sults as well as higher results from internal services and the
equity business including the reversal of an impairment on an
investment of €51 million, posted in a previous year. These
higher results were partly offset by an increase in loss reserves
in the commercial finance business. Total assets rose slightly,
to €11.704 billion.
impacted by the factors mentioned for volume, as well as mea-
sures to reduce IT costs for Siemens and €22 million in net sev-
erance charges during the fourth quarter. Both periods in-
cluded charges related to large projects in the UK. Those
charges were significantly higher in the prior-year period when
they resulted in a net negative effect on profit of €76 million.
Cross-Sector Businesses
Siemens IT Solutions and Services
Orders and revenue for Siemens IT Solutions and Services
declined by 15% and 12% year-over-year, respectively, due to
increasingly challenging external markets in the course of the
fiscal year and streamlined internal business with Siemens.
Profit for fiscal 2009 was €90 million compared to €144 million
a year earlier. Profit development in the current period was
B25T020_E
Year ended September , % Change therein
(in millions of €) Actual Adjusted
Currency Portfolio
Profit 90 144 (38)%
Profit margin 1.9% 2.7%
New orders 4,501 5,272 (15)% (10)% (2)% (3)%
Total revenue 4,686 5,325 (12)% (8)% (1)% (3)%
External revenue 3,580 3,845 (7)%
Therein:
Europe, C.I.S.2, Africa, Middle East 3,129 3,326 (6)%
Therein Germany 1,307 1,451 (10)%
Americas 399 430 (7)%
Asia, Australia 52 89 (42)%
1 Excluding currency translation and portfolio effects. 2 Commonwealth of Independent States.
(in millions of €)
Year ended September 30, % Change
2009 2008
Income before income taxes 304 286 6%
Total assets 11,704 11,328 3%
B25T021_E
(in millions of €)
September 30,
2009 2008
Allocated equity 1,243 1,113
Total debt 9,521 9,359
Therein intragroup financing 9,455 9,233
Therein debt from external sources 66 126
Debt to equity ratio 7.66 8.41
Cash and cash equivalents 136 28
B25T022_E