Siemens 2009 Annual Report Download - page 235
Download and view the complete annual report
Please find page 235 of the 2009 Siemens annual report below. You can navigate through the pages in the report by either clicking on the pages listed below, or by using the keyword search tool below to find specific information within the annual report.-
 1
1 -
2
-
3
-
4
-
5
-
6
-
7
-
8
-
9
-
10
-
11
-
12
-
13
-
14
-
15
-
16
-
17
-
18
-
19
-
20
-
21
-
22
-
23
-
24
-
25
-
26
-
27
-
28
-
29
-
30
-
31
-
32
-
33
-
34
-
35
-
36
-
37
-
38
-
39
-
40
-
41
-
42
-
43
-
44
-
45
-
46
-
47
-
48
-
49
-
50
-
51
-
52
-
53
-
54
-
55
-
56
-
57
-
58
-
59
-
60
-
61
-
62
-
63
-
64
-
65
-
66
-
67
-
68
-
69
-
70
-
71
-
72
-
73
-
74
-
75
-
76
-
77
-
78
-
79
-
80
-
81
-
82
-
83
-
84
-
85
-
86
-
87
-
88
-
89
-
90
-
91
-
92
-
93
-
94
-
95
-
96
-
97
-
98
-
99
-
100
-
101
-
102
-
103
-
104
-
105
-
106
-
107
-
108
-
109
-
110
-
111
-
112
-
113
-
114
-
115
-
116
-
117
-
118
-
119
-
120
-
121
-
122
-
123
-
124
-
125
-
126
-
127
-
128
-
129
-
130
-
131
-
132
-
133
-
134
-
135
-
136
-
137
-
138
-
139
-
140
-
141
-
142
-
143
-
144
-
145
-
146
-
147
-
148
-
149
-
150
-
151
-
152
-
153
-
154
-
155
-
156
-
157
-
158
-
159
-
160
-
161
-
162
-
163
-
164
-
165
-
166
-
167
-
168
-
169
-
170
-
171
-
172
-
173
-
174
-
175
-
176
-
177
-
178
-
179
-
180
-
181
-
182
-
183
-
184
-
185
-
186
-
187
-
188
-
189
-
190
-
191
-
192
-
193
-
194
-
195
-
196
-
197
-
198
-
199
-
200
-
201
-
202
-
203
-
204
-
205
-
206
-
207
-
208
-
209
-
210
-
211
-
212
-
213
-
214
-
215
-
216
-
217
-
218
-
219
-
220
-
221
-
222
-
223
-
224
-
 225
225 -
 226
226 -
 227
227 -
 228
228 -
 229
229 -
 230
230 -
 231
231 -
 232
232 -
 233
233 -
 234
234 -
 235
235 -
 236
236 -
 237
237 -
 238
238 -
 239
239 -
 240
240 -
 241
241 -
 242
242 -
 243
243 -
 244
244 -
 245
245 -
246
-
247
-
248
-
249
-
250
-
251
-
252
-
253
-
254
-
255
-
256
-
257
-
258
-
259
-
260
-
261
-
262
-
263
-
264
-
265
-
266
-
267
-
268
-
269
-
270
-
271
-
272
-
273
-
274
-
275
-
276
-
277
-
278
-
279
-
280
-
281
-
282
-
283
-
284
-
285
-
286
-
287
-
288
-
289
-
290
-
291
-
292
-
293
-
294
-
295
-
296
-
297
-
298
-
299
-
300
-
301
-
302
-
303
-
304
-
305
-
306
-
307
-
308
-
309
-
310
-
311
-
312
-
313
-
314
-
315
-
316
-
317
-
318
-
319
-
320
-
321
-
322
 |
 |

Managing Board statements, Independent auditors’ report, Additional information
Notes to Consolidated Financial Statements
(in millions of €, except where otherwise
stated and per share amounts)
ing and discontinued operations for the years ended Septem-
ber 30, 2009 and 2008 were €7 and €13, respectively. Gross re-
alized losses on sales of such available-for-sale financial assets
for continuing and discontinued operations for the years
ended September 30, 2009 and 2008 were €10 and €1, respec-
tively.
Available-for-sale financial assets classified as non-current are
included in Other financial assets (see Note 20).
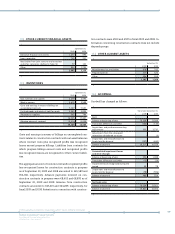
TRADE AND OTHER RECEIVABLES
The valuation allowance on the Company ’s current and long-
term receivables (see Notes 12, 13 and 20), (except for receiv-
ables from finance leases) which belong to the class of Finan-
cial assets and liabilities measured at (amortized) cost,
changed as follows:
Including the items charged or credited directly to equity and
the expense (benefit) from continuing and discontinued oper-
ations, the income tax expense (benefit) consists of the fol-
lowing:
AVAILABLE-FOR-SALE FINANCIAL ASSETS
The following tables summarize the current portion of the
Company ’s investment in available-for-sale financial assets:
Proceeds from sales of available-for-sale financial assets traded
in an active market for the years ended September 30, 2009
and 2008 were €35 and €49, respectively. Gross realized gains
on sales of such available-for-sale financial assets for continu-
Year ended September ,
2009 2008
Continuing operations 1,434 1,015
Discontinued operations 58 (184)
Income and expense recognized
directly in equity (231) (120)
1,261 711
B27T018_E
Abweichend vom Deutschen
September 30, 2009
CostFair Value Unrealized
Gain
Unrealized
Loss
Equity instruments 719 12 –
Debt instruments 109 112 3 –
Fund shares 38 39 1 –
154 170 16 –
B27T019_E
B27T020_E
September ,
Cost Fair Value Unrealized
Gain
Unrealized
Loss
Equity instruments 32 26 – (6)
Debt instruments 84 85 1 –
Fund shares 40 41 1 –
156 152 2 (6)
September ,
2009 2008
Trade receivables from the sale of goods
and services 12,644 14,062
Receivables from finance leases 1,738 1,674
Receivables from joint ventures
and associates and other companies
167 49
14,449 15,785
1 Other companies, in the context of the above line item, are those in which Siemens
has an ownership interest of less than 20% and exercises no significant influence
over their operating and financial policies.
B27T021_E
Year ended September ,
2009 2008
Valuation allowance as of beginning
of fiscal year 913 805
Increase in valuation allowances recorded in
the income statement in the current period 449 247
Write-offs charged against the allowance (222) (141)
Recoveries of amounts previously written-off 7 18
Foreign exchange translation differences (24) (5)
Reclassification to Assets held for disposal (7) (11)
Valuation allowance as of fiscal year-end 1,116 913
B27T022_E