Siemens 2009 Annual Report Download - page 175
Download and view the complete annual report
Please find page 175 of the 2009 Siemens annual report below. You can navigate through the pages in the report by either clicking on the pages listed below, or by using the keyword search tool below to find specific information within the annual report.-
 1
1 -
2
-
3
-
4
-
5
-
6
-
7
-
8
-
9
-
10
-
11
-
12
-
13
-
14
-
15
-
16
-
17
-
18
-
19
-
20
-
21
-
22
-
23
-
24
-
25
-
26
-
27
-
28
-
29
-
30
-
31
-
32
-
33
-
34
-
35
-
36
-
37
-
38
-
39
-
40
-
41
-
42
-
43
-
44
-
45
-
46
-
47
-
48
-
49
-
50
-
51
-
52
-
53
-
54
-
55
-
56
-
57
-
58
-
59
-
60
-
61
-
62
-
63
-
64
-
65
-
66
-
67
-
68
-
69
-
70
-
71
-
72
-
73
-
74
-
75
-
76
-
77
-
78
-
79
-
80
-
81
-
82
-
83
-
84
-
85
-
86
-
87
-
88
-
89
-
90
-
91
-
92
-
93
-
94
-
95
-
96
-
97
-
98
-
99
-
100
-
101
-
102
-
103
-
104
-
105
-
106
-
107
-
108
-
109
-
110
-
111
-
112
-
113
-
114
-
115
-
116
-
117
-
118
-
119
-
120
-
121
-
122
-
123
-
124
-
125
-
126
-
127
-
128
-
129
-
130
-
131
-
132
-
133
-
134
-
135
-
136
-
137
-
138
-
139
-
140
-
141
-
142
-
143
-
144
-
145
-
146
-
147
-
148
-
149
-
150
-
151
-
152
-
153
-
154
-
155
-
156
-
157
-
158
-
159
-
160
-
161
-
162
-
163
-
164
-
 165
165 -
 166
166 -
 167
167 -
 168
168 -
 169
169 -
 170
170 -
 171
171 -
 172
172 -
 173
173 -
 174
174 -
 175
175 -
 176
176 -
 177
177 -
 178
178 -
 179
179 -
 180
180 -
 181
181 -
 182
182 -
 183
183 -
 184
184 -
 185
185 -
186
-
187
-
188
-
189
-
190
-
191
-
192
-
193
-
194
-
195
-
196
-
197
-
198
-
199
-
200
-
201
-
202
-
203
-
204
-
205
-
206
-
207
-
208
-
209
-
210
-
211
-
212
-
213
-
214
-
215
-
216
-
217
-
218
-
219
-
220
-
221
-
222
-
223
-
224
-
225
-
226
-
227
-
228
-
229
-
230
-
231
-
232
-
233
-
234
-
235
-
236
-
237
-
238
-
239
-
240
-
241
-
242
-
243
-
244
-
245
-
246
-
247
-
248
-
249
-
250
-
251
-
252
-
253
-
254
-
255
-
256
-
257
-
258
-
259
-
260
-
261
-
262
-
263
-
264
-
265
-
266
-
267
-
268
-
269
-
270
-
271
-
272
-
273
-
274
-
275
-
276
-
277
-
278
-
279
-
280
-
281
-
282
-
283
-
284
-
285
-
286
-
287
-
288
-
289
-
290
-
291
-
292
-
293
-
294
-
295
-
296
-
297
-
298
-
299
-
300
-
301
-
302
-
303
-
304
-
305
-
306
-
307
-
308
-
309
-
310
-
311
-
312
-
313
-
314
-
315
-
316
-
317
-
318
-
319
-
320
-
321
-
322
 |
 |

87
Managing Board statements, Independent auditors’ report, Additional information
95 Net assets position 97 Report on post-balance sheet date events
98 Risk report
108 Information required pursuant to
§315 (4) HGB of the German Commercial
Code and explanatory report
114 Compensation report
114 Report on expected developments
Siemens has no other agreements with nationally recognized
statistical rating organizations to provide long-term and short-
term credit ratings.
Please be advised that security ratings are not a recommenda-
tion to buy, sell or hold securities. Credit ratings may be subject
to revision or withdrawal by the rating agencies at any time.
Also considering the current deterioration of capital markets,
each rating should be evaluated independently of any other
rating.
CASH FLOW – FISCAL COMPARED TO FISCAL
The following discussion presents an analysis of our cash
flows for fiscal 2009 and 2008 for both continuing and discon-
tinued operations. In the periods under review discontinued
operations includes SV, which was sold to Continental AG in
fiscal 2008, as well as the former Com activities. For further in-
formation on the disposal of the SV activities and the former
Com segment see “Notes to Consolidated Financial State-
ments.”
We report Free cash flow as a performance measure, which is
defined as “Net cash provided by (used in) operating activities”
less cash used for “Additions to intangible assets and property,
plant and equipment.” We believe this measure is helpful to
our investors as an indicator of our ability to generate cash
from operations and to pay for discretionary and non-dis-
cretionary expenditures not included in the measure, such as
dividends, debt repayment or acquisitions. We also use Free
cash flow to compare cash generation among the segments
of our business. Free cash flow should not be considered in
isolation or as an alternative to measures of cash flow calcu-
lated in accordance with IFRS. For further information about
this measure please refer to the end of this Management’s dis-
cussion and analysis.
Operating activities provided net cash of €6.564 billion in fis-
cal 2009, compared to net cash provided of €8.624 billion in
fiscal 2008. These results include both continuing and discon-
tinued operations. Within the total, continuing operations
provided net cash of €6.709 billion compared to €9.281 billion a
year earlier. The decline in cash flow includes lower billings in
excess of costs year-over-year compared to a substantial in-
crease in fiscal 2008, in the Energy and Industry Sectors, as
well as a substantial decrease in trade payables compared to
an increase in fiscal 2008, especially in the Industry Sector.
Other contributing factors include substantial cash outflows in
connection with previously disclosed charges mainly posted to
income in fiscal 2008. These outflows include €1.008 billion
paid to authorities in the US and Germany related to charges
for the resolution of legal proceedings. Cash outflows also
arise from severance charges of €796 million for the global
SG&A program and other personnel-related restructuring mea-
sures. In addition to these outflows substantial payments for
charges related to project reviews in Fossil Power Generation,
Mobility and Siemens IT Solutions and Services. Positive fac-
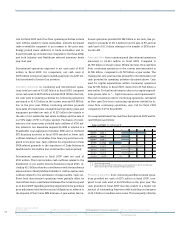
Free cash flow
Continuing
operations
Discontinued
operations
Continuing and
discontinued operations
Year ended September 30, Year ended September 30, Year ended September 30,
(in millions of €) 2009 2008 2009 2008 2009 2008
Net cash provided by (used in):
Operating activities A 6,709 9,281 (145) (657) 6,564 8,624
Investing activities (3,431) (9,989) (194) 9,582 (3,625) (407)
Herein: Additions to intangible assets
and property, plant and equipment B (2,923) (3,542) – (179) (2,923) (3,721)
Free cash flow
A+B 3,786 5,739 (145) (836) 3,641 4,903
1 The closest comparable financial measure under IFRS is “Net cash provided by (used in) operating activities.” “Net cash provided by (used in) operating activities” from continuing
operations as well as from continuing and discontinued operations is reported in our “Consolidated Statements of Cash Flow.” “Additions to intangible assets and property, plant and
equipment” from continuing operations is reconciled to the figures as reported in the “Consolidated Statements of Cash Flow” in the “Notes to Consolidated Financial Statements.”
Other companies that report Free cash flow may define and calculate this measure differently.
B25T026_E