Siemens 2009 Annual Report Download - page 61
Download and view the complete annual report
Please find page 61 of the 2009 Siemens annual report below. You can navigate through the pages in the report by either clicking on the pages listed below, or by using the keyword search tool below to find specific information within the annual report.-
 1
1 -
2
-
3
-
4
-
5
-
6
-
7
-
8
-
9
-
10
-
11
-
12
-
13
-
14
-
15
-
16
-
17
-
18
-
19
-
20
-
21
-
22
-
23
-
24
-
25
-
26
-
27
-
28
-
29
-
30
-
31
-
32
-
33
-
34
-
35
-
36
-
37
-
38
-
39
-
40
-
41
-
42
-
43
-
44
-
45
-
46
-
47
-
48
-
49
-
50
-
 51
51 -
 52
52 -
 53
53 -
 54
54 -
 55
55 -
 56
56 -
 57
57 -
 58
58 -
 59
59 -
 60
60 -
 61
61 -
 62
62 -
 63
63 -
 64
64 -
 65
65 -
 66
66 -
 67
67 -
 68
68 -
 69
69 -
 70
70 -
 71
71 -
72
-
73
-
74
-
75
-
76
-
77
-
78
-
79
-
80
-
81
-
82
-
83
-
84
-
85
-
86
-
87
-
88
-
89
-
90
-
91
-
92
-
93
-
94
-
95
-
96
-
97
-
98
-
99
-
100
-
101
-
102
-
103
-
104
-
105
-
106
-
107
-
108
-
109
-
110
-
111
-
112
-
113
-
114
-
115
-
116
-
117
-
118
-
119
-
120
-
121
-
122
-
123
-
124
-
125
-
126
-
127
-
128
-
129
-
130
-
131
-
132
-
133
-
134
-
135
-
136
-
137
-
138
-
139
-
140
-
141
-
142
-
143
-
144
-
145
-
146
-
147
-
148
-
149
-
150
-
151
-
152
-
153
-
154
-
155
-
156
-
157
-
158
-
159
-
160
-
161
-
162
-
163
-
164
-
165
-
166
-
167
-
168
-
169
-
170
-
171
-
172
-
173
-
174
-
175
-
176
-
177
-
178
-
179
-
180
-
181
-
182
-
183
-
184
-
185
-
186
-
187
-
188
-
189
-
190
-
191
-
192
-
193
-
194
-
195
-
196
-
197
-
198
-
199
-
200
-
201
-
202
-
203
-
204
-
205
-
206
-
207
-
208
-
209
-
210
-
211
-
212
-
213
-
214
-
215
-
216
-
217
-
218
-
219
-
220
-
221
-
222
-
223
-
224
-
225
-
226
-
227
-
228
-
229
-
230
-
231
-
232
-
233
-
234
-
235
-
236
-
237
-
238
-
239
-
240
-
241
-
242
-
243
-
244
-
245
-
246
-
247
-
248
-
249
-
250
-
251
-
252
-
253
-
254
-
255
-
256
-
257
-
258
-
259
-
260
-
261
-
262
-
263
-
264
-
265
-
266
-
267
-
268
-
269
-
270
-
271
-
272
-
273
-
274
-
275
-
276
-
277
-
278
-
279
-
280
-
281
-
282
-
283
-
284
-
285
-
286
-
287
-
288
-
289
-
290
-
291
-
292
-
293
-
294
-
295
-
296
-
297
-
298
-
299
-
300
-
301
-
302
-
303
-
304
-
305
-
306
-
307
-
308
-
309
-
310
-
311
-
312
-
313
-
314
-
315
-
316
-
317
-
318
-
319
-
320
-
321
-
322
 |
 |

59
European Green City Index
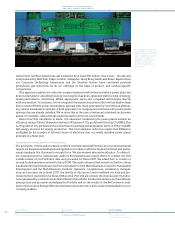
But our commitment doesn’t stop there. In 2009, we commissioned the Economist Intelligence
Unit (EIU) to produce the European Green City Index, a Europe-wide study of ecofriendly urban
development. The EIU assessed the sustainability of infrastructures in 30 cities – from Paris to Is-
tanbul and from Stockholm to Athens – in as many European countries. The European Green City
Index is the first study to comprehensively analyze the environmental measures being imple-
mented in Europe’s urban centers.
The study examines qualitative and quantitative factors in eight environmental categories – CO2
emissions, energy, buildings, transport, water, waste and land use, air quality, and green gover-
nance – and summarizes green initiatives and best-practice projects from which other cities can
learn. Urban administrators and other interested parties can use the study’s rankings to evaluate
the strengths and weaknesses of urban centers within a given region, of a similar size or with a
comparable GDP.
The European Green City Index is a valuable tool designed to help urban decision-makers further
improve their infrastructures in the years to come.
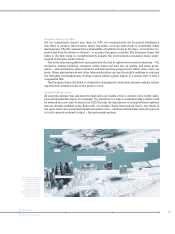
Forward-looking results
All analyses indicate that advanced technologies can enable cities to achieve even highly ambi-
tious environmental targets. For example, CO2 emissions in a major conurbation like London could
be reduced by more than 40 percent by 2025 through the deployment of energy-efficient systems
that are already available today. Better still, our studies clearly demonstrate that in two-thirds of
the cases cities can recoup their initial investment costs – which would total less than one percent
of a city’s annual economic output – through energy savings.
With the world’s largest
Environmental Portfolio,
a budget to date of
roughly €1 billion for
environmental research
activities, and some
14,000 green patents,
we’re making a major con-
tribution to sustainable
urban development.
Consulting services for sustainable
urban development
Consulting services for
public administration
Water and wastewater
management
Traffic control systems
and urban mass transit
Energy supply systems and
environmental protection
Building technologies
Healthcare
Education
Airport systems
Public security
Ports
Our structure
60 Interview with Barbara Kux