Siemens 2009 Annual Report Download - page 216
Download and view the complete annual report
Please find page 216 of the 2009 Siemens annual report below. You can navigate through the pages in the report by either clicking on the pages listed below, or by using the keyword search tool below to find specific information within the annual report.-
 1
1 -
2
-
3
-
4
-
5
-
6
-
7
-
8
-
9
-
10
-
11
-
12
-
13
-
14
-
15
-
16
-
17
-
18
-
19
-
20
-
21
-
22
-
23
-
24
-
25
-
26
-
27
-
28
-
29
-
30
-
31
-
32
-
33
-
34
-
35
-
36
-
37
-
38
-
39
-
40
-
41
-
42
-
43
-
44
-
45
-
46
-
47
-
48
-
49
-
50
-
51
-
52
-
53
-
54
-
55
-
56
-
57
-
58
-
59
-
60
-
61
-
62
-
63
-
64
-
65
-
66
-
67
-
68
-
69
-
70
-
71
-
72
-
73
-
74
-
75
-
76
-
77
-
78
-
79
-
80
-
81
-
82
-
83
-
84
-
85
-
86
-
87
-
88
-
89
-
90
-
91
-
92
-
93
-
94
-
95
-
96
-
97
-
98
-
99
-
100
-
101
-
102
-
103
-
104
-
105
-
106
-
107
-
108
-
109
-
110
-
111
-
112
-
113
-
114
-
115
-
116
-
117
-
118
-
119
-
120
-
121
-
122
-
123
-
124
-
125
-
126
-
127
-
128
-
129
-
130
-
131
-
132
-
133
-
134
-
135
-
136
-
137
-
138
-
139
-
140
-
141
-
142
-
143
-
144
-
145
-
146
-
147
-
148
-
149
-
150
-
151
-
152
-
153
-
154
-
155
-
156
-
157
-
158
-
159
-
160
-
161
-
162
-
163
-
164
-
165
-
166
-
167
-
168
-
169
-
170
-
171
-
172
-
173
-
174
-
175
-
176
-
177
-
178
-
179
-
180
-
181
-
182
-
183
-
184
-
185
-
186
-
187
-
188
-
189
-
190
-
191
-
192
-
193
-
194
-
195
-
196
-
197
-
198
-
199
-
200
-
201
-
202
-
203
-
204
-
205
-
 206
206 -
 207
207 -
 208
208 -
 209
209 -
 210
210 -
 211
211 -
 212
212 -
 213
213 -
 214
214 -
 215
215 -
 216
216 -
 217
217 -
 218
218 -
 219
219 -
 220
220 -
 221
221 -
 222
222 -
 223
223 -
 224
224 -
 225
225 -
 226
226 -
227
-
228
-
229
-
230
-
231
-
232
-
233
-
234
-
235
-
236
-
237
-
238
-
239
-
240
-
241
-
242
-
243
-
244
-
245
-
246
-
247
-
248
-
249
-
250
-
251
-
252
-
253
-
254
-
255
-
256
-
257
-
258
-
259
-
260
-
261
-
262
-
263
-
264
-
265
-
266
-
267
-
268
-
269
-
270
-
271
-
272
-
273
-
274
-
275
-
276
-
277
-
278
-
279
-
280
-
281
-
282
-
283
-
284
-
285
-
286
-
287
-
288
-
289
-
290
-
291
-
292
-
293
-
294
-
295
-
296
-
297
-
298
-
299
-
300
-
301
-
302
-
303
-
304
-
305
-
306
-
307
-
308
-
309
-
310
-
311
-
312
-
313
-
314
-
315
-
316
-
317
-
318
-
319
-
320
-
321
-
322
 |
 |

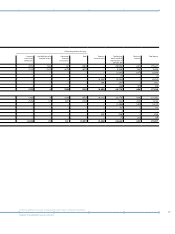
Segment Information (continuing operations)
Reports Supervisory Board /
Managing Board Corporate Governance Management’s discussion and analysis Consolidated Financial Statements
Consolidated Statements of Income Consolidated Statements of Income
and Expense Recognized in Equity
Consolidated Balance Sheets Consolidated Statements of Cash Flow
As of and for the fi scal years ended September 30, 2009 and 2008
New orders External revenue Intersegment revenue Total revenue
(in millions of €) 2009 2008
Sectors
Industry 33,284 42,374 33,915 36,526 1,128 1,127 35,043 37,653
Energy 30,076 33,428 25,405 22,191 388 386 25,793 22,577
Healthcare 11,950 11,779 11,864 11,116 63 54 11,927 11,170
Total Sectors 75,310 87,581 71,184 69,833 1,579 1,567 72,763 71,400
Equity Investments – – – – – – – –
Cross-Sector Businesses
Siemens IT Solutions and Services 4,501 5,272 3,580 3,845 1,106 1,480 4,686 5,325
Siemens Financial Services (SFS) 778 756 663 675 114 81 777 756
Reconciliation to Consolidated
Financial Statements
Other Operations 714 2,899 787 2,454 49 448 836 2,902
Siemens Real Estate (SRE) 1,763 1,665 364 388 1,399 1,277 1,763 1,665
Corporate items and pensions 140 167 73 132 67 16 140 148
Eliminations, Corporate Treasury
and other reconciling items (4,215) (4,845) – – (4,314) (4,869) (4,314) (4,869)
Siemens 78,991 93,495 76,651 77,327 – – 76,651 77,327
1 This supplementary information on New orders is provided on a voluntary basis. It is not part of the audited Consolidated Financial Statements.
2 Profi t of the Sectors as well as of Equity Investments, Siemens IT Solutions and Services and Other Operations is earnings before fi nancing interest, certain pension costs and income taxes.
Certain other items not considered performance indicative by Management may be excluded. Profi t of SFS and SRE is Income before income taxes.
3 Assets of the Sectors as well as of Equity Investments, Siemens IT Solutions and Services and Other Operations is defi ned as Total assets less income tax assets, less non-interest bearing
liabilities/provisions other than tax liabilities. Assets of SFS and SRE is Total assets.
4 Free cash fl ow represents net cash provided by (used in) operating activities less additions to intangible assets and property, plant and equipment. Free cash fl ow of the Sectors, Equity
Investments, Siemens IT Solutions and Services and Other Operations primarily exclude income tax, fi nancing interest and certain pension related payments and proceeds. Free cash fl ow
of SFS, a fi nancial services business, and of SRE includes related fi nancing interest payments and proceeds; income tax payments and proceeds of SFS and SRE are excluded.
B26T006